


In patients with non-cystic fibrosis bronchiectasis (BE) Pseudomonas aeruginosa (PA) has been recently associated with low rather than high number of exacerbations without distinguishing chronic versus intermittent infection. The aim of our study was to determine whether the intermittent or chronic stage of P. aeruginosa (PA) infection is associated with the rate of exacerbations, quality of life and respiratory microbiome biodiversity after a one-year follow-up.
MethodsWe conducted a longitudinal study, with 1-year follow-up, in patients with BE intermittently or chronically infected by PA involving sequential (3-monthly) measurements of microbiological (cultures, PA load, phenotype and biofilms presence) immunological (Serum IgGs against P. aeruginosa were measured by ELISA immunoassay) and clinical variables (Quality-of-Life and the number exacerbations). Additionaly, 16S sequencing was performed on a MiSeq Platform and compared between chronically infected patients with the mucoid PA versus intermittently infected patients with the non-mucoid PA.
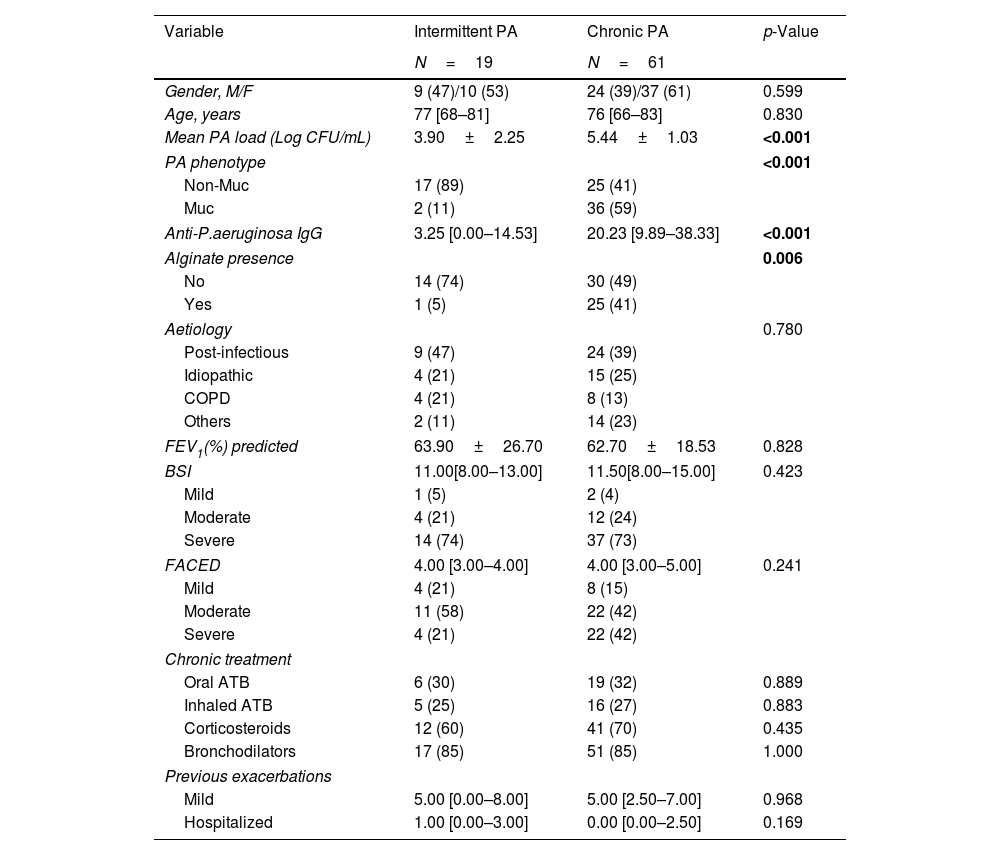
ResultsWe collected 235 sputa and 262 serum samples from 80 BE patients, 61 with chronic and 19 with intermittent PA infection. Chronically compared to intermittently.
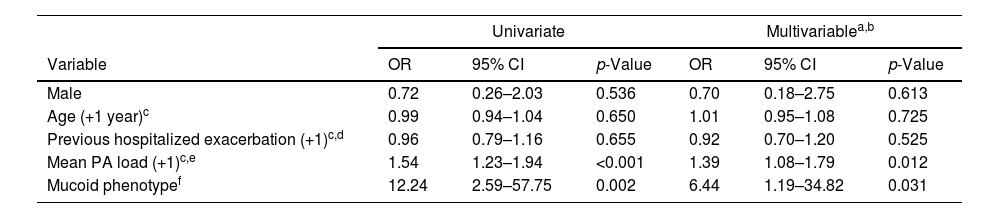
Presented reduced quality of life but less hospitalized exacerbations after 1-year follow-up. Chronically infected patients presented reduced sputum biodiversity and higher systemic IgGs against P. aeruginosa levels that were associated to decreased number of hospitalized exacerbations.
ConclusionsThe assessment of Chronic versus intermittent P. aeruginosa infection has clinical implications such as quality of life, rate of hospitalized exacerbations and lung microbiome biodiversity. The distinction of these two phenotypes is easy to perform in clinical practice.
Trial registrationNCT04803695.


