Journal Information
Share
Share
Download PDF
More article options
Visits
2350
Original Article
Full text access
Available online 29 July 2024
Changes in the Functional Classification of Spirometry Using the New Interpretation Standard 2022: A Multicenter Study
Visits
2350
Santiago C. Arcea,
Corresponding author
arcesantiago@fibertel.com.ar

Corresponding author.
, Carlos Aguirre-Francob, Patricia Schonffeldt-Guerreroc, Cecilia Rodríguez-Floresd, Laura Gochicoa-Rangele
a Instituto de Investigaciones Médicas A. Lanari, Universidad de Buenos Aires, Argentina
b Laboratorio de Pruebas de Función Pulmonar, Fundación Neumológica Colombiana, Bogotá, Colombia
c Laboratorio de Función Pulmonar, Instituto Nacional del Tórax, Santiago de Chile, Chile
d Laboratorio de Función Pulmonar, Hospital Maciel, Facultad de Medicina, Montevideo, Uruguay
e Departamento de Fisiología Respiratoria, Instituto Nacional de Enfermedades Respiratorias «Ismael Cosío Villegas», Ciudad de México, Mexico
This item has received
Article information
Abstract
Full Text
Bibliography
Download PDF
Statistics
Figures (6)
Show moreShow less
Tables (4)
Table 1. General characteristics of the studied population.
Table 2. Diagnostic classification by the 2005 and the 2022 statements on interpretation of spirometry (N=79,039).
Table 3. Bronchodilator response conversion rate when switching from the 2005 to the 2022 algorithms.
Show moreShow less
Additional material (1)
Abstract
Introduction

Pulmonary function tests are vital for diagnosing lung diseases, assessing treatment responses, and monitoring respiratory health. Recent updates to interpretive standards by the European Respiratory and American Thoracic Societies (ERS/ATS) in 2022 introduced significant changes compared to the 2005 standards. They include incorporating lung volume measurements, non-specific and mixed disorders, introducing z-scores for functional abnormality assessment, reducing severity categories from five to three, and revising criteria for positive bronchodilator responses.

Methods

We conducted a retrospective, multi-center study across four centers using spirometric data spanning from 2002 to 2022. We categorized spirometry results using both the 2005 and 2022 ATS/ERS standards and calculated predicted values following the GLI 2012 equation (Caucasian subset).

Results

Among 79,039 subjects, we observed that 23% shifted from an obstructive diagnosis under the 2005 standard to a mixed pattern diagnosis under the 2022 standard, necessitating lung volume assessments. In the evaluation of bronchodilator responses among 59,203 tests, 12.3% of those initially classified as responders were reclassified as non-responders with the new standards. We found variations in severity categorization across age groups, with older patients tending to receive milder severity classifications and younger individuals receiving greater severity classifications under the 2022 standards.

Conclusions

The 2022 document emphasizes early lung volume assessment, potentially leading to increased utilization of more complex tests. Furthermore, the bronchodilator response was predominant in extreme age groups and among individuals with milder spirometric impairments. This shift may impact treatment decisions, potentially initiating medication in milder cases and de-escalating treatment in more severe cases.

Keywords:
Spirometry
Interpretation
Pulmonary function tests
Bronchodilation
Full Text
Introduction

Pulmonary function tests reflect physiological properties of the respiratory system (breathing mechanics, gas exchange, etc.). These tests have been used for decades for diagnosing lung diseases and their follow-up, assess response to treatment, explain dyspnea and monitor the effect of exposure to potentially harmful substances. As such, an update of their interpretive strategies has been recently released by the European Respiratory Society (ERS) and American Thoracic Society (ATS).1

In this update, three essential considerations for the interpretation process are outlined: (1) to classify observed values as either within or outside the normal range compared to a healthy population; (2) to understand the physiological determinants of test results in correlation with identified abnormalities; and (3) to integrate identified patterns with additional clinical data to inform differential diagnosis and guide therapy.1,2

The document has 4 main differences in relation to the 2005 ATS/ERS standards related to spirometry: (1) the role of lung volumes measurements to identify clearly those individuals with a mixed pattern (obstructive with low total lung capacity), the restrictive patterns and those with an unspecified disorder; (2) use of z-score to graduate the functional abnormality, which evaluates how far the actual measurement is from the expected average for a healthy individual of the same height, age and sex, in contrast to the previous standard that did so according to the percentage of the predicted value; (3) use of three severity categories, instead of the five previously used; (4) new calculation to consider a positive bronchodilator (BD) response.3

These modifications may alter spirometric diagnoses for a variable number of patients who were previously classified according to the 2005 standard. Thus, the objectives of this study were: (1) to determine the proportion of subjects in our database whose functional diagnosis or severity category will change with the new standards; (2) to calculate the percentage of the population whose response to BD will change with the new standards; and (3) to delineate the factors influencing classification changes under the new interpretation algorithms.

Methods

This is a retrospective, analytic, multi-center study conducted in four high-volume reference centers in Latin America (Argentina, Chile, Colombia and Mexico). Spirometric data from all-aged and all-cause patients obtained between 2002 and 2022 were included. The databases were downloaded as worksheets from each device, without manual transcription. Only studies previously accepted and reported by the local staff were used. Rejected studies were discarded.

Predicted values and their derived variables were calculated according to the GLI 2012 equation (Caucasian subset).4 Spirometry results were classified based on pre-BD values, according to the published algorithms in the ATS/ERS 20052 and 2022 editions.1 For the former, spirometries were assigned one out of 3 possible categories: normal (FEV1/FVCLLN and FVCLLN), obstructive (FEV1/FVC<LLN) and possible restriction (FEV1/FVCLLN and FVC<LLN). In obstructive spirometries, severity was classified into five levels, based on the percent predicted of FEV1 (FEV1%): mild (≥70%), moderate (60–69%), moderately severe (50–59%), severe (35–49%) and very severe (<35%).

For the 2022 edition, a fourth diagnostic category was added: mixed (FEV1/FVC<LLN & FVC<LLN). And obstruction severity was classified according to FEV1z-score in mild (≥−2.5), moderate (−2.51 to −4) and severe (<−4.1).

In tests with post-BD phase, response was also assessed with both algorithms. According to the 2005 consensus, it was considered positive when either FEV1 or FVC showed a change ≥200mL and ≥12% from baseline. In the 2022 consensus, a change from baseline ≥10 percent compared to the predicted value was required.

Statistical analysis

The database was visually inspected in search of outliers for the main variables, including age, height, weight, and the main spirometric variables. Each outlier was eliminated. When possible, a search for the original test was made and it was reviewed to decide its inclusion.

Descriptive statistics were used to characterize the population, chi-square and McNemar tests to compare proportions, and Student's t-test or U Mann–Whitney to compare continuous variables, according to their distribution. Correlation between age groups was assessed using the Tukey analysis. The statistical analysis was made with Stata v.1.6. The study was approved by the Institutional Review Board from the National Institute of Respiratory Diseases (C-39-22).

To avoid statistical bias in clusters with small number of tests, analysis and charting was performed only for clusters larger than 10 studies.

Results

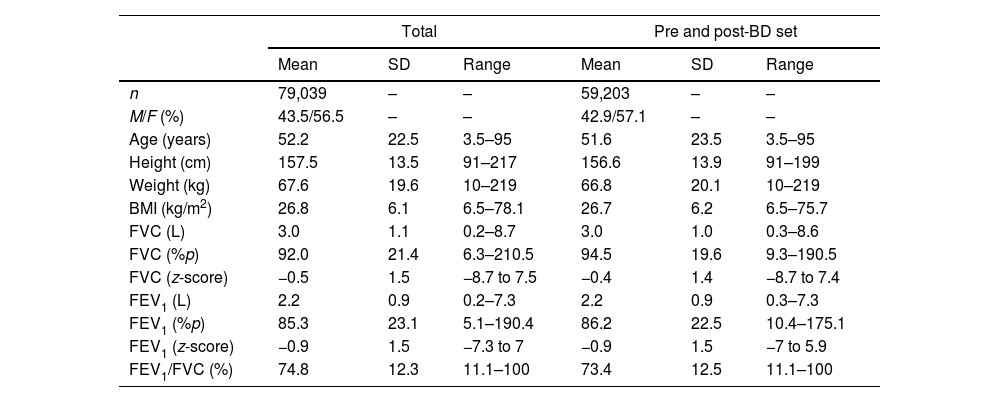
Data from 79,039 subjects were obtained, with ages ranging from 3 to 95 years. Out of them, pre-BD and post-BD tests were available for 59,204 studies. General characteristics of the population and by center can be appreciated in Table 1 and S1.

Table 1.

General characteristics of the studied population.

  TotalPre and post-BD set
  Mean  SD  Range  Mean  SD  Range 
n  79,039  –  –  59,203  –  – 
M/F (%)  43.5/56.5  –  –  42.9/57.1  –  – 
Age (years)  52.2  22.5  3.5–95  51.6  23.5  3.5–95 
Height (cm)  157.5  13.5  91–217  156.6  13.9  91–199 
Weight (kg)  67.6  19.6  10–219  66.8  20.1  10–219 
BMI (kg/m226.8  6.1  6.5–78.1  26.7  6.2  6.5–75.7 
FVC (L)  3.0  1.1  0.2–8.7  3.0  1.0  0.3–8.6 
FVC (%p92.0  21.4  6.3–210.5  94.5  19.6  9.3–190.5 
FVC (z-score)  −0.5  1.5  −8.7 to 7.5  −0.4  1.4  −8.7 to 7.4 
FEV1 (L)  2.2  0.9  0.2–7.3  2.2  0.9  0.3–7.3 
FEV1 (%p85.3  23.1  5.1–190.4  86.2  22.5  10.4–175.1 
FEV1 (z-score)  −0.9  1.5  −7.3 to 7  −0.9  1.5  −7 to 5.9 
FEV1/FVC (%)  74.8  12.3  11.1–100  73.4  12.5  11.1–100 

SD=standard deviation; BD=bronchodilator; M=male; F=female; BMI=body mass index; FVC=forced vital capacity; FEV1=forced exhalation volume in the first second; %p=percentage of predicted.

The proportion of normal and possible restriction/non-specific patterns did not change between algorithms. The 2005 algorithm classified 11,390 studies (14.4%) as possible restriction, same as the 2022 algorithm with the equivalent possible restriction or non-specific pattern. From the 18,084 spirometries initially classified as obstructive, 13,940 retained the same classification in 2022, while the remaining 4144 studies were now considered as possible mixed disorders by the new statement (Table 2). Together, restrictive and mixed, sum 15,534 spirometries (19.6% of the total studies) with potential further derivation to assess lung volumes. Spirometric pattern classification by sex can be observed in Tables S2 and S3.

Table 2.

Diagnostic classification by the 2005 and the 2022 statements on interpretation of spirometry (N=79,039).

2005  Normal  Possible restriction  Obstructive  Total 
2022
Normal  49,565      49,565 
Possible restriction or non-specific    11,390    11,390 
Obstructive      13,940  13,940 
Mixeda      4144  4144 
Total  49,565  11,390  18,084  79,039 
a

Possibly mixed impairment. Lung volumes are needed to confirm.

The distribution of severity for the same set of spirometries differed between both algorithms (Fig. 1). Undoubtedly, since distribution differed greatly, there had to exist migration of severity when moving from one standard to the other. This is pictured in Fig. 2, where any severity of the latter algorithm is composed by tests that were classified differently with the older standard. The proportion of individuals in whom severity of obstruction is modified with the new algorithm differed between sexes (Fig. 2, lower panels). But a progression to a milder classification in elder people is seen with the new algorithm and this was also observed for each gender separately (Fig. S1).

Fig. 1.

Proportion of severity classification by the 2005 and 2022 statements (n=13,940).

(0.08MB).
Fig. 2.

Severity assignment of obstructive spirometries accordingly with the 2005 and 2022 statements, total and by sex (n=13,940). Left and right lower panels are for males and females, respectively.

(0.19MB).

Fig. 3 shows the correlation of obstruction severity for every single test between the previous 2005 classification based in percent of predicted of FEV1 and the new 2022 z-score method, divided for 3 age ranges. This figure illustrates that severity is less frequent for older people when the z-score method is used, while it is greater in young people.

Fig. 3.

Correlation of severity by percentage and by z-score in obstructive spirometries (n=13,940). p<0.001 for the differences between slopes.

(0.19MB).

Among pre-BD and post-BD tests (n=59,203), the proportion of studies with a positive or negative response to BD changed between algorithms (Table 3). Overall, 12.3% of tests originally classified as positives, became negative with the new formulas. Conversely, 4.1% originally with a negative response, were positive with the new standard. Agreement between both classifications had a kappa 0.811 (95% CI 0.805–0.817), % agreement 94.5%. Results were similar for mild [kappa 0.728 (IC95 0.691–0.764); agreement 86.59%], moderate [kappa 0.811 (IC95 0.795–0.828); agreement 90.86%] and severe obstruction [kappa 0.84 (IC95 0.829–0.852); agreement 92.84%].

Table 3.

Bronchodilator response conversion rate when switching from the 2005 to the 2022 algorithms.

  Positive 2005(n=10,084)  Negative 2005(n=49,119) 
Positive 2022  8844 (87.7%)  2020 (4.1%) 
Negative 2022  1240 (12.3%)  47,099 (95.9%) 

In the distribution by age, the rate of positive responses to BD was similar with both algorithms, except for the extremes of life (younger than 15 and older than 80 years), where the proportion of positive responses was higher with the 2022 statement (Fig. 4). In subjects with a functional diagnosis of obstruction, the 2005 algorithm classified a higher proportion of tests as positives among more severe patients, while the 2022 algorithm did it with the less severe cases (FEV1z-score<−1.8 and FEV1z-score>−1.6) (Fig. 5). Differences were also found in restrictive spirometries according to FVC z-score (Fig. S2), as well as for FEV1/FVC z-score in the whole database (Fig. S3).

Fig. 4.

Bronchodilator response rate, by age according to 2005 and 2022 standards (n=59,203). *p<0.05.

(0.2MB).
Fig. 5.

Bronchodilator response rate in obstructive patients, by FEV1z-score according to 2005 and 2022 standards (n=15,994). *p<0.05. Positive bronchodilator response is less frequently diagnosed with the new algorithm in more severely obstructed patients.

(0.27MB).
Discussion

It is expected that there will be changes in the functional spirometric diagnosis, when using the 2022 interpretation standard, especially in patients classified as obstructive. In our database, approximately 23% of those individuals shifted to a mixed category, eventually requiring lung volume measurements. Additionally, 12.3% of previously categorized positive responders to BD are expected to be reclassified as non-responders. Factors influencing these changes could include age, sex, underlying diseases, and disease severity.

The main difference between both algorithms in terms of functional diagnosis is the opportunity to perform lung volume assessment. While the 2005 statement2 used an algorithm that went completely across all the spirometric data, the 2022 version1 inserts lung volume measurement earlier in the decision making, which is the reason why it includes the mixed pattern as another diagnostic category, as well as the non-specific pattern. From the point of view of health care costs, this could lead to an increase in the use of more complex methods. In fact, if both algorithms are strictly followed, the 2022 document could lead to an increase of ∼23% in volume measurement prescription, which possibly won’t be available in every region. Even though, it could allow a more accurate diagnosis.

This diagnosis and severity migration is probably more frequent in the so called “zone of uncertainty”, near the boundaries between categories. The present concern is how wide, or narrow is this zone, and how to decide clinical and follow up measures.

We decided to analyze severity only in obstructive patients, since the remaining abnormal spirometric patterns are not conclusive by themselves. The other spirometric patterns are subject to further confirmation, whether it be by clinical assessment or by other methods.5 For BD response, we analyzed also FVC since it can be expected to change also in non-obstructive tests (Fig. S2).

The 2005 statement recommended 5 levels of severity based on percent predicted, while the 2022 document recommends 3 levels, based on z-score. An uneven migration between severities was found. So, as shown in Fig. 3, the severity correlation varies with age, in a way that, for the same percent predicted, severity will be underestimated in older patients and overestimated in younger patients.

As pictured in Fig. 2 and S1, tests reported with the 2022 statement, can correspond to many possible severities if the 2005 classification were still in use. This emphasizes the need to declare in the reports which statement is being used. If not, the treating physician receiving the report could consider an adverse clinical course, especially in young subjects, when in fact a new definition is being used. The proportion of patients migrating in severity, changed with aging. Older patients had a bigger chance to be considered with a milder severity with the 2022 standard. This was confirmed in both sexes for most age groups and severities. These findings stress that, with the new standard, aged patients are now considered less ill.

Although z-score can be considered the best way of classifying severity,6 this method has not been adopted by most clinical guidelines, where schemes based on FVC or FEV1 percent predicted are still used.7 Additionally, comparison of both strategies has not shown clinical superiority of the z-score strategy.8 In fact, the 2022 guide warns that spirometry severity classification by z-score doesn’t imply disease severity, which in turn can comprehend other variables or methods.1 This calls to caution when establishing severity cutoff points tied to treatment initiation or escalation. Considering this, in the future we may probably see many present day clinical guidelines that use percent predicted having to redesign their algorithms. Future studies clarifying new z-score based cutoff points should be awaited.

Another important issue is what concerns BD response. Of note, the calculation of BD response has changed between statements, since the 2005 version considers a change from baseline values, while the 2022 guide requires a change in percent of predicted. The latter could be read as how much closer to predicted value are the patient's efforts after receiving BD. As data are showing, this change in the way to calculate response can modify previous perceptions on the patients’ status.

The 2022 statement produces an overall relative increase in the BD response of 7.73%. As detailed in Figs. 4 and 5, this increase in BD response prevalence is mostly in the extreme ages and less severe spirometric impairments, and although it is proposed that reporting FEV1 as a percentage of the predicted FEV1 or as z-score avoids sex and height bias in assessing BD responsiveness, from a clinical point of view, those patients will now be classified as de novo asthmatics or uncontrolled asthmatics, as well as it could imply an increase in the prescription of inhaled medication, especially corticosteroids. Of notice, is the fact that this migration from non-responsive to BD-responsive is mostly seen in milder cases (Fig. 5). On the contrary, the more severe cases are less deemed to be classified as respondents, potentially leading to a de-escalation of treatment in this fragile population.

Two previous studies deal with bronchodilator response in obstructive patients.9,10 This contrasts with our findings (1.3% decrease with the new standard). This can possibly explained by the fact that our sample included children and all-diagnosis patients, while the former included only adult patients with obstructive diseases. As seen, the increase in bronchodilator responsive diagnosis was larger in children, what can have contributed to the increase.

A recent paper, explored the economical implications of adopting the proposed race-based and race-neutral spirometric equations.11 It found changes in the proportion of spirometric diagnostic classification, medical impairment ratings, occupational eligibility, disability compensation that differed according to self-reported race.

Although economical implications are beyond the scope of this paper, they must also be considered. The change in bronchodilator response rates can affect the market of airway obstruction medications. From a semantic point of view, caution must be taken when qualifying severity, since the same term can be ascribed to a different magnitude of impairment, depending on the use of the 2005 or the 2022 classification. And this will specially be prevalent in aged people, which are also more susceptible to chronic respiratory diseases. So, the numerical cutoff value must be added in the report. Notwithstanding, it is unknown for every specific disease which are the outcome related cutoff values. As such, new algorithms based on z-score severity classification will necessarily be developed.

Undoubtedly, the combination of new impairment and bronchodilator response definitions, and predicted equations will bring up changes in classifications. They are proposed on more extensive and robust information than in the past, but can be modified in the future with the arrival of new evidence on this topic.

This paper has some limitations. Tests included in the final analysis were deemed of sufficient quality for inclusion in the conclusive report for each respective examination. Quality assessments were not consistently accessible across all databases due to disparities between software used. Nevertheless, this discrepancy does not alter the spirometric interpretations that can be derived from software algorithms or any interpreter relying on the numerical data. As such, functional diagnosis and classifications are predicated upon numerical data, aligning with the recommended methodology in the majority of authoritative statements and guidelines.

The database doesn’t include lung volume measurements that could help to define if they were needed or not. Also, we don’t have the clinical diagnosis or context of each individual. As usual, the number of subjects in the extremes of each variable is small, which could magnify or bias the statistical significance at such points. On the other hand, the large number of included patients included allowed the creation and analysis of many subgroups but could also magnify the statistical significance in ranges without clinical significance.

The diagnosis and classifications within this study are functionally reliant solely on spirometry. It is essential to note that this does not, by any means, constitute a clinical diagnosis but rather illustrates the potential to influence or bias it based on two distinct assessments of the same dataset. It is conceivable that similar findings may be replicated using alternative lung function tests beyond spirometry, and forthcoming research grounded in these alternative approaches may shed further light on this matter. Furthermore, these results prompt a reconsideration of the validity of prior work.

Conclusions

The application of the new standard of interpretation in respiratory function tests, specifically in spirometry, may generate a change in the functional diagnosis leading to a large number of subjects requiring the measurement of lung volumes. The change in the severity of the disease is observed mainly in old age, while the application of the new formula to define response to the BD could identify a greater number of responsive subjects, especially at the extremes of age and in mild cases.

The findings presented in this paper offer insight into the implications of spirometric results for future research endeavors.

Funding statement

This study did not receive funding.

Author contribution statement

Co-author  ORCID  Author Contribution Statement 
S.C.A.  0000-0003-2629-3262  Contributed to the conception and design of the work, the acquisition, analysis, and interpretation of the data, the drafting of the manuscript, and revision of the manuscript. 
C.A.F.  0000-0001-9001-0613  Contributed to the conception and design of the work, the acquisition, analysis, and interpretation of the data, the drafting of the manuscript, and revision of the manuscript. 
P.S.G.  0000-0002-0716-1726  Contributed to the conception and design of the work, the acquisition, analysis, and revision of the manuscript. 
C.R.F.  0000-0001-9373-0827  Contributed to the conception and design of the work, the interpretation of the data, revision and drafting of the manuscript. 
L.G.R.  0000-0003-3009-5867  Contributed to the conception and design of the work, the acquisition, analysis, and interpretation of the data, the drafting of the manuscript, and revision of the manuscript. Final approval of the version to be published. 

ICMJE disclosure form

S.C.A: Received support from Sanofi for attending ALAT congress in 2019.

C.A.F: Have received personal payment for being speaker for Glaxo, Sanofi and Boehringer and Advisory board for Sanofi.

P.S.G: Have received personal payment for being speaker for Glaxo, Astra-Zeneca, Sanofi. Respiratory Functional Tests Coordinator from The Sociedad Chilena de Enfermedades Respiratorias.

C.R.F: Have received personal payment for being speaker and Advisory board for Glaxo, and support from Astra-Zeneca and Boehringer - Ingelheim for attending ALAT, ATS and ERS congress.

L.G.R: Have received personal payment for being speaker for Glaxo, Astra-Zeneca, Chiesi, PulmOne, Thorasys, Vyaire. Personal loan of equipment-Evernoa device for FeNO measurements.

Conflict of interests

The authors state that they have no conflict of interests.

Appendix B
Supplementary data

The followings are the supplementary data to this article:

References
[1]
S. Stanojevic, D.A. Kaminsky, M.R. Miller, B. Thompson, A. Aliverti, I. Barjaktarevic, et al.
ERS/ATS technical standard on interpretive strategies for routine lung function tests. ERS/ATS technical standard on interpretive strategies for routine lung function tests.
Eur Respir J, 60 (2022), pp. 2101499
[2]
R. Pellegrino, G. Viegi, V. Brusasco, R.O. Crapo, F. Burgos, R. Casaburi, et al.
Interpretative strategies for lung function tests.
Eur Respir J, 26 (2005), pp. 948-968
[3]
M.R. Miller, J. Hankinson, V. Brusasco, F. Burgos, R. Casaburi, A. Coates, et al.
Standardisation of spirometry.
Eur Respir J, 26 (2005), pp. 319-338
[4]
P.H. Quanjer, S. Stanojevic, T.J. Cole, X. Baur, G.L. Hall, B.H. Culver, et al.
Multi-ethnic reference values for spirometry for the 3–95-yr age range: the global lung function 2012 equations.
Eur Respir J, 40 (2012), pp. 1324-1343
[5]
P. Enright.
Body plethysmography is not helpful for COPD diagnosis, determination of severity, phenotyping, nor response to therapy.
[6]
P.H. Quanjer, J.J. Pretto, D.J. Brazzale, P.W. Boros.
Grading the severity of airways obstruction: new wine in new bottles.
Eur Respir J, 43 (2014), pp. 505-512
[7]
A. Agustí, B.R. Celli, G.J. Criner, D. Halpin, A. Anzueto, P. Barnes, et al.
Global initiative for chronic obstructive lung disease 2023 report: GOLD executive summary.
Eur Respir J, 61 (2023), pp. 2300239
[8]
E. Tejero, E. Prats, R. Casitas, R. Galera, P. Pardo, A. Gavilán, et al.
Classification of airflow limitation based on z-score underestimates mortality in patients with chronic obstructive pulmonary disease.
Am J Respir Crit Care Med, 196 (2017), pp. 298-305
[9]
W. Chaiwong, A. Deesomchok, C. Pothirat, P. Duangjit, C. Liwsrisakun.
Impact of the new European respiratory (ERS)/American Thoracic Society (ATS) pulmonary function test interpretation guidelines 2021 on the interpretation of bronchodilator responsiveness in subjects with airway obstruction.
Respir Med, 220 (2023), pp. 107460
[10]
Y. Li, J. Lin, Z. Wang, Z. Wang, L. Tan, S. Liu, et al.
Bronchodilator responsiveness defined by the 2005 and 2021 ERS/ATS criteria in patients with asthma as well as chronic obstructive pulmonary disease.
Int J Chron Obstruct Pulmon Dis, 17 (2022), pp. 2623-2633
[11]
J.A. Diao, Y. He, R. Khazanchi, M.J. Nguemeni Tiako, J.I. Witonsky, E. Pierson, et al.
Implications of race adjustment in lung-function equations.
Copyright © 2024. SEPAR
Archivos de Bronconeumología
Article options
Tools

Are you a health professional able to prescribe or dispense drugs?