


Computed tomography (CT) of the chest is considered the gold standard for the diagnosis of bronchiectasis,1 but quantification of bronchiectasis remains a challenge. Several visual CT score systems have been developed, particularly for quantification of bronchiectasis in cystic fibrosis (CF). These have a higher sensitivity than lung function for detection of early abnormalities and can be used as an outcome measurement in clinical practice and research,2 but they rely on subjective visual analysis, require specific training, and are time-consuming, limiting its use in clinical practice.
CT lung densitometry is based on the variable attenuation of X-rays in pulmonary tissue. A dedicated software segments the lung from the mediastinum and chest wall, and the density value of each pulmonary voxel is measured in Hounsfield units (HU). This method has been used in emphysema quantification,3 interstitial lung disease quantification,4 and more recently, studies have investigated the role of CT lung densitometry in CF bronchiectasis and in primary ciliary dyskinesia,5–7 with good correlations with visual CT scores and pulmonary function tests (PFT).
In this letter, the authors report the use of CT lung densitometry as an automated quantitative method in non-CF bronchiectasis patients with severe disease. We also aimed to investigate the correlation of quantitative CT lung densitometry with PFT in these subjects, particularly air trapping.
Between May 2014 and October 2017, 167 consecutive adult patients were seen in a bronchiectasis outpatient clinic. Sixty-seven patients were excluded because of diagnosis of CF, asthma, chronic obstructive pulmonary disease (COPD), pregnancy, recent treatment of pulmonary exacerbation (<30 days), active or previous smoking (>10 pack-year), previous pulmonary surgery and inability to perform PFT.8 One hundred non-CF bronchiectasis patients were enrolled in this study. Volumetric inspiratory and expiratory supine chest CT without intravenous contrast administration was performed in a 160-detector multislice CT scanner (Aquillion Prime, Canon Medical Systems Corporation, Japan) and images were reconstructed with adaptative iterative software (AIDR 3D – Canon Medical Systems Corporation, Japan) using a standard kernel (FC 01) at 1mm slice thickness and 0.8mm intervals. Patients underwent spirometry and plethysmography on the same day as the CT exam, following standard technical parameters.9–11 Severe air trapping on PFT was defined as residual volume (RV)/total lung capacity (TLC)>60.12 CT lung densitometry was performed with a free, open-source software (3D Slicer, version 4.7; National Institutes of Health funded; https://www.slicer.org) with a lung-specific module (Chest Imaging Platform - Applied Chest Imaging Laboratory, Brigham and Women's Hospital, Boston, MA, USA). Automated air trapping quantification (E/I MLD) was measured by a previous described method.13 Visual CT score (CF-CT score14) was performed independently by two trained radiologists: the total score (CF-CT score) and the air trapping component score (AT score) were recorded in absolute values, and the mean value of both readers was used in the analysis. Multidimensional prognostic scores (BSI15 and FACED16) were also calculated, classifying the severity of bronchiectasis according to its prognosis. Patients classified as moderate and severe disease based on FACED were grouped as high-risk patients since they are related to increased mortality risk.
Data are expressed as mean±standard deviation (SD) and frequency (percentage). Correlations were determined using Spearman's correlation coefficient. For the identification of severe air trapping and high-risk patients, receiver operator characteristic (ROC) curves were compared using the DeLong method. All statistical analyses were performed using the R statistical software (version 3.4.3, R Foundation for Statistical Computing, Vienna, Austria) and a p-value<0.05 was considered statically significant.
Mean patient age was 43±15 years, Fifty-seven percent were female and idiopathic bronchiectasis (34%) was the most prevalent etiology, followed by primary ciliary dyskinesia (20%), post infectious bronchiectasis (14%) and other etiologies (32%). Mean forced expiratory volume in 1 second (FEV1) was 49%±20, with most patients presenting air trapping according to residual volume/total lung capacity rate (RV/TLC). Regarding multidimensional scores, 37% had mild, 56% moderate and 7% severe FACED score, and 46% had mild, 35% moderate and 19% severe BSI score. Most of the participants were classified as high-risk patients (moderate and severe scores combined): 63% according to FACED and 54% according to BSI.
Mean visual CF-CT score was 54±18 (ranging from 14 to 99) and mean AT score was 11±5. The average time required to obtain the visual CT score was 14±4min. Regarding automated CT quantification, mean skewness, kurtosis and E/I MLD values were 3.2±0.5, 7.1±2.9 and 0.91±0.05, respectively. The average time required to obtain the lung density measures for each series was 2.5±0.5min.
Worse lung function and increased air trapping (measured by both plethysmograph and quantitative CT) were correlated with increased bronchiectasis severity according to FACED and BSI scores.
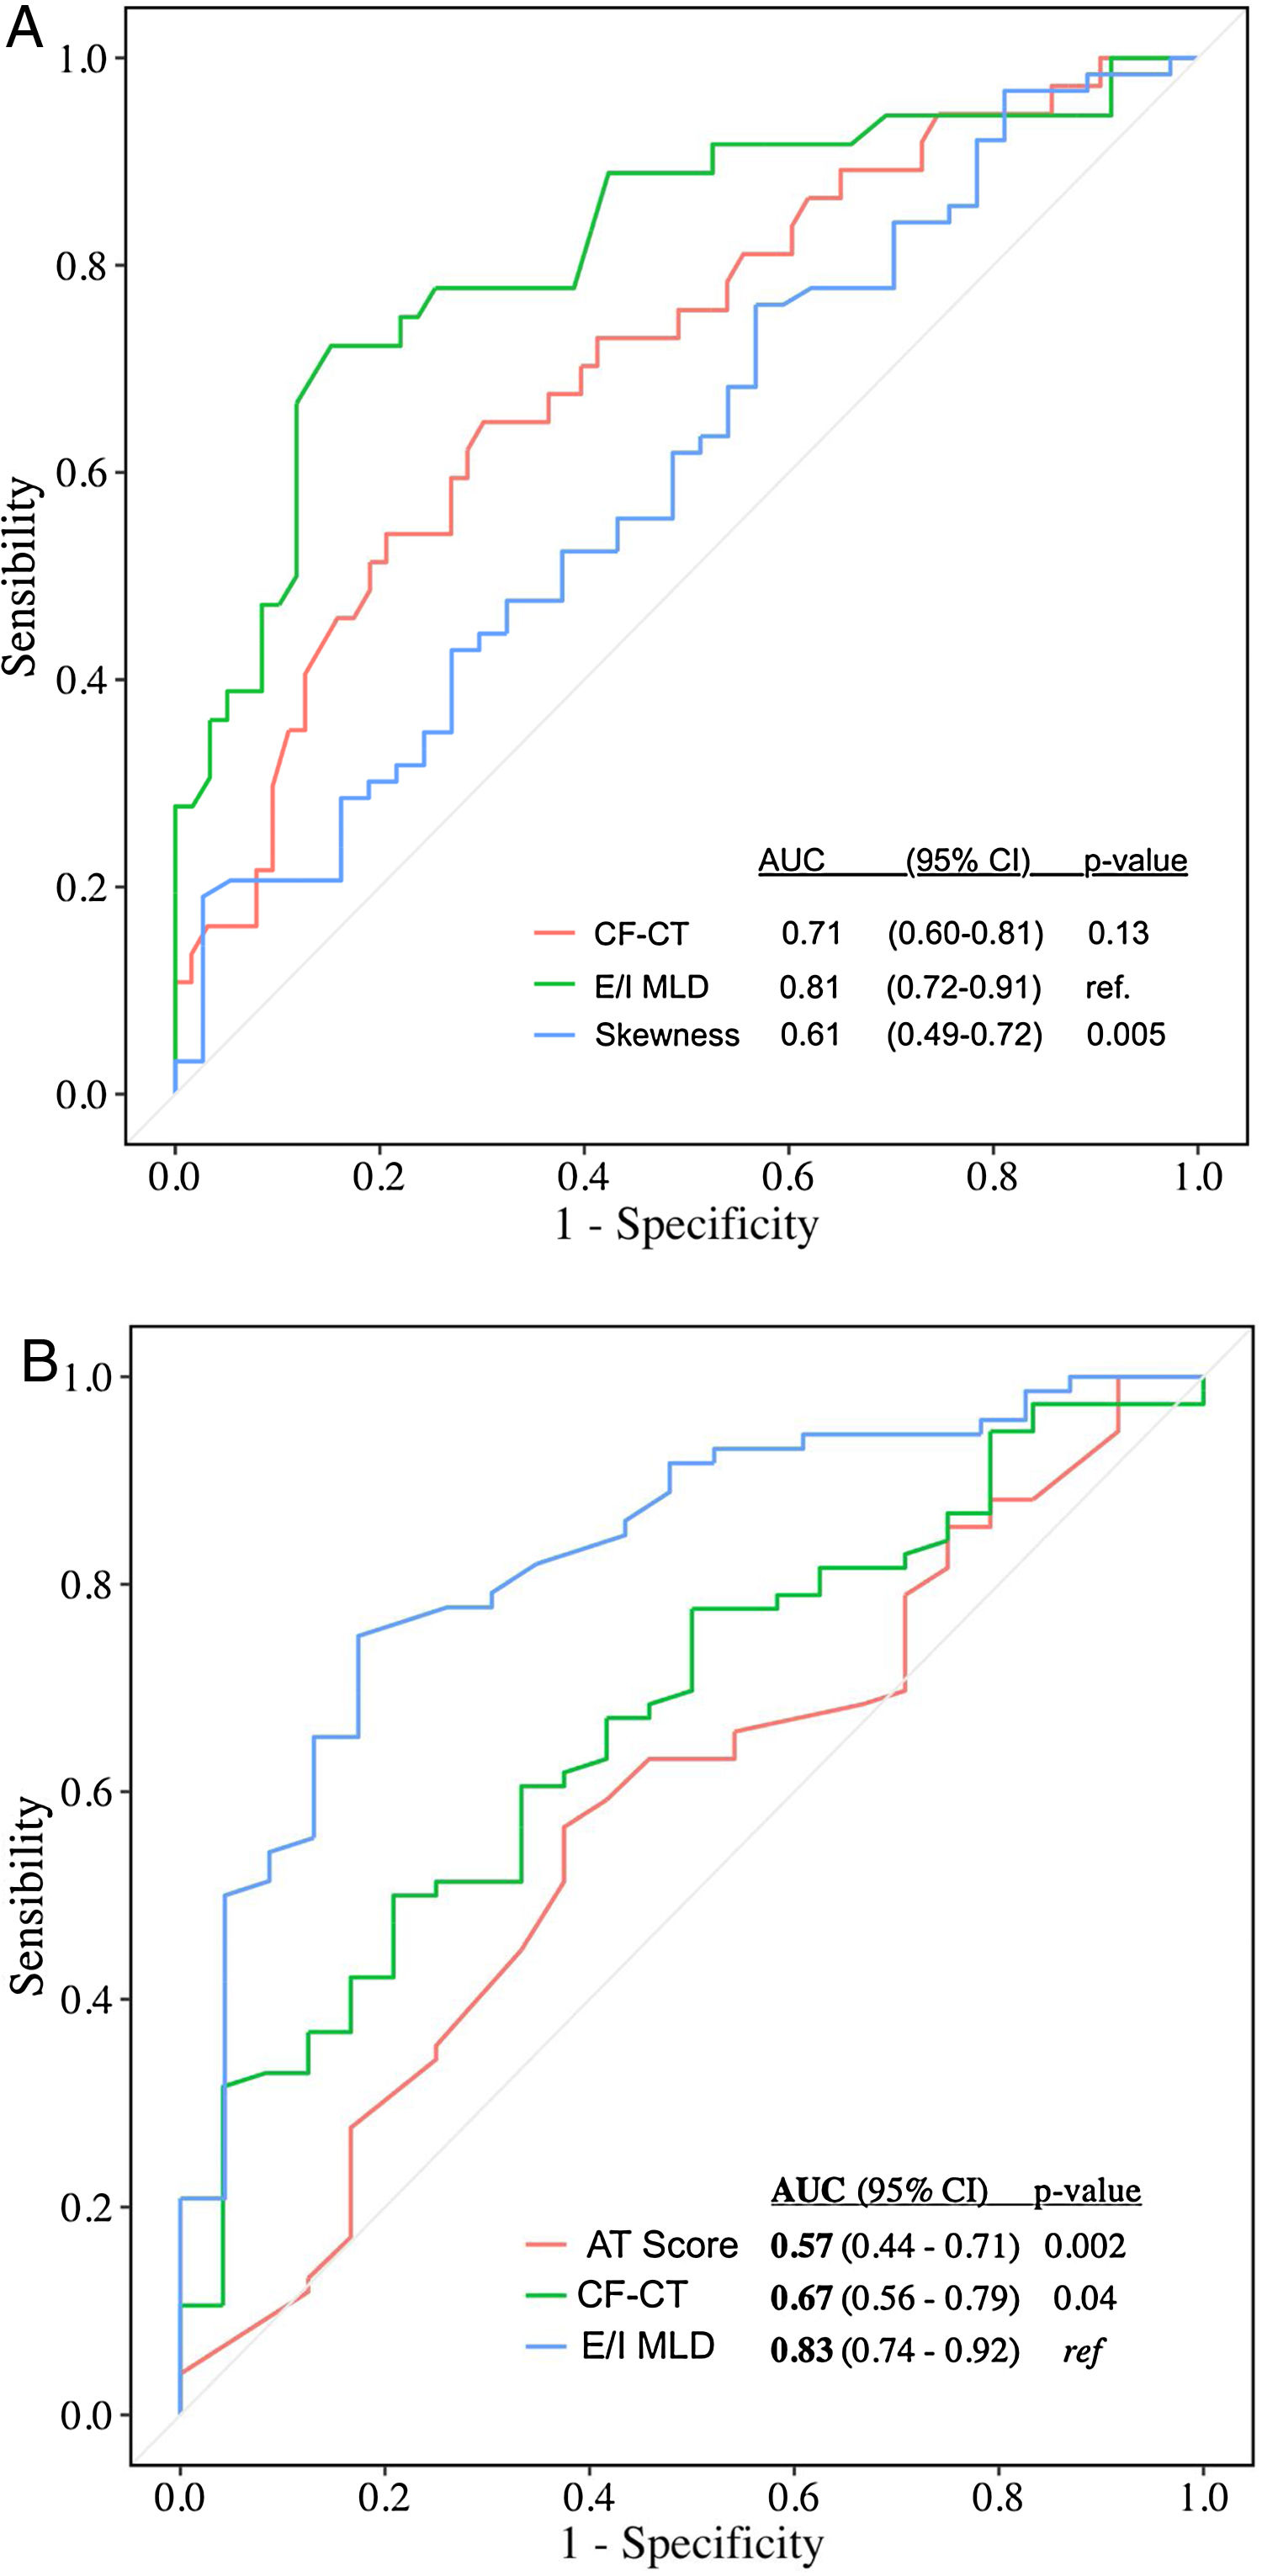
Automated CT quantification parameters correlated with multidimensional prognostic scores and PFT (Table 1), as similar studies with CF and primary ciliary dyskinesia demonstrated.5–7 Automated air trapping quantification (E/I MLD) performed better than visual CT score in the identification of high-risk patients (patients with moderate and severe FACED score): area under the curve (AUC)=0.81 {confidence interval (CI) 95% 0.72–0.91} for E/I MLD versus AUC=0.71 (CI 95% 0.60-0.81) for the CF-CT score (Fig. 1a). E/I MLD also performed better in the identification of severe air trapping (patients with RV/TLC>60) with AUC=0.83 (CI 95% 0.74–0.92) for E/I MLD versus AUC=0.67 (CI 95% 0.56–0.79) for the CF-CT score (Fig. 1b).
Correlations of visual CT scores (CF-CT score; AT score), lung densitomety parameters (skewness, kurtosis and E/I MLD) with lung function and multidimensional scores (FACED and BSI).
| FEV1 (p value) | FVC (p value) | FEV1/FVC (p value) | RV (p value) | RV/TLC (p value) | DLco (p value) | FACED score (p value) | BSI score (p value) | |
|---|---|---|---|---|---|---|---|---|
| CF-CT score | −0.43 (<0.001) | −0.38 (<0.001) | −0.29 (0.003) | 0.44 (<0.001) | 0.50 (<0.001) | −0.43 (<0.001) | 0.32 (0.001) | 0.24 (0.01) |
| AT score | −0.48 (<0.001) | −0.32 (0.001) | −0.42 (<0.001) | 0.42 (<0.001) | 0.30 (0.002) | −0.30 (0.004) | 0.28 (0.004) | 0 (0.98) |
| Skewness | 0.34 (<0.001) | 0.58 (<0.001) | −0.01 (0.9) | −0.11 (0.27) | −0.38 (<0.001) | 0.43 (<0.001) | −0.22 (0.03) | −0.28 (0.005) |
| Kurtosis | 0.32 (<0.001) | 0.57 (<0.001) | −0.04 (0.68) | −0.10 (0.34) | −0.36 (<0.001) | 0.41 (<0.001) | −0.21 (0.03) | −0.29 (0.003) |
| E/I MLD | −0.51 (<0.001) | −0.35 (<0.001) | −0.57 (<0.001) | 0.63 (<0.001) | 0.68 (<0.001) | −0.42 (<0.001) | 0.53 (<0.001) | 0.29 (0.004) |
FEV1: forced expiratory volume in 1 second; FVC: forced vital capacity; RV: residual volume; TLC: total lung capacity; DLCO: diffusing capacity of carbon monoxide.
 Accuracy of CF-CT score, E/I MLD and skewness in discriminating high-risk patients (moderate and severe FACED score). AUC: area under the ROC curve. (B) Accuracy of CF-CT score, AT score and E/I MLD in discriminating patients with severe air trapping (RV/TLC>60). AUC: area under the ROC curve.")
(A) Accuracy of CF-CT score, E/I MLD and skewness in discriminating high-risk patients (moderate and severe FACED score). AUC: area under the ROC curve. (B) Accuracy of CF-CT score, AT score and E/I MLD in discriminating patients with severe air trapping (RV/TLC>60). AUC: area under the ROC curve.
Previous studies have highlighted the importance of bronchiolitis and small airway disease in bronchiectasis patients17 and an increased mortality in bronchiectasis patients with a high RV/TLC ratio.18 Visual quantification in CT scans is subjective, can underestimate the degree of air trapping and is time consuming.2 With that in mind, we believe that automated CT quantification of air trapping may add value to the CT scan evaluation.
CT lung density is known to be influenced by several factors, such as lung volumes, CT scanner models, CT scanner calibration, X-ray dose and reconstruction kernel.19 In our study, all the CT exams were acquired in one calibrated scanner, and images were reconstructed with the same reconstruction algorithm and kernel. We optimized radiation dose, especially on expiratory scans, to comply with CT radiation reference levels.20
Limitations of our study include the single-center and cross-sectional design. Also, we did not use spirometry control for lung volumes in the CT scan, although all patients were trained to hold maximal inspiration and maximal expiration before the exam.
This study suggests that CT lung densitometry could be a fast, objective and reproducible method of quantification of lung disease in a non-CF bronchiectasis population. CT lung densitometry parameters correlated with PFT parameters and automated air trapping quantification (E/I MLD) was superior to the visual CT score (CF-CT) in the diagnosis of high-risk patients and patients with severe air trapping. Since air trapping seems to have a prognostic role in bronchiectasis patients, we believe that an objective quantification of air trapping on CT scans could be a useful tool in the evaluation of these patients.
Authors’ contributionsMVYS and RAA had full access to all of the data in the study and take responsibility for the integrity of the data and the accuracy of the data analysis. MCNTMN, SZR, AC, RS, ANAJ, MST and CHN contributed substantially to the study design, data analysis and interpretation, and the writing of the manuscript.
FundingSão Paulo Research Foundation (FAPESP) funded the study (protocol number 2015/14638-2).
This research was approved by our Institutional Ethics Committee (2.697.966, 06-07-2018) and all methods were carried out in accordance with relevant guidelines and regulations.
Conflicts of interestsThe authors have no conflicts of interests to declare.


