

Several classification systems use different criteria when assessing COPD stages. The objective of this study was to compare the prevalence and distribution of COPD stages using Global initiative for chronic Obstructive Lung Disease (GOLD) recommendations and Latin American Thoracic Association (ALAT) guidelines in a primary-care population.
MethodsSubjects attending routine primary care visits, ≥40 years of age, current or former smokers or exposed to biomass, completed a questionnaire and performed spirometry. COPD was defined as post-bronchodilator FEV1/FVC<0.70 and categorized according to GOLD-2013 criteria and ALAT-2014 guideline. The BODEx index was used to assess the prognostic value of the stratification systems.
ResultsA total of 1743 subjects completed the interview, 1540 performed acceptable spirometry. COPD prevalence according to GOLD-2013 was 20.1% and had a U-shaped stage distribution (group A: 9.3%, B: 4.3%, C: 2.0%, D: 4.6%). According to ALAT, prevalence was 19.7% with a bell-shaped stage distribution (mild: 2.9%, moderate: 9%, severe: 5.4%, very-severe: 2.7%). Approximately 73% of patients were stratified as moderate (45.4%) or severe (27.3%) by ALAT guidelines, whereas using GOLD-2013 criteria the majority of subjects (approximately 69%) were in group A (46.3%) or group B (22.7%). BODE index score increased as COPD worsened according to ALAT stratification. This is not observed with GOLD-2013 criteria (similar values for B and C groups).
ConclusionsDisease stages differ under ALAT and GOLD-2013 criteria. ALAT identified a greater proportion of COPD subjects in the moderate and severe categories compared with GOLD-2013, where the majority were categorized in group A. Future evaluation of the ALAT classification should address its predictive ability in terms of hospitalizations and mortality.
En los diferentes sistemas de clasificación de la EPOC se utilizan diversos criterios de estadificación. El objetivo de este estudio fue comparar la prevalencia y la distribución de los estadios de la EPOC con las recomendaciones de la iniciativa global para la enfermedad pulmonar obstructiva crónica (GOLD) y las orientaciones de la Asociación Latinoamericana de Tórax (ALAT) en una población de atención primaria.
MétodosSujetos ≥40 años de edad, fumadores, exfumadores o expuestos a biomasa que acudieron a visitas rutinarias en centros de atención primaria cumplimentaron un cuestionario y se sometieron a una espirometría. Se definió EPOC si el cociente FEV1/FVC era <0,70 tras la administración de un broncodilatador, y se calificó de acuerdo con los criterios GOLD-2013 y ALAT-2014. El valor pronóstico de los sistemas de estratificación se evaluó mediante el índice BODEx.
ResultadosCumplimentaron la entrevista 1.743 pacientes, de los cuales 1.540 obtuvieron espirometrías aceptables. Según los criterios GOLD-2013 la prevalencia de EPOC fue de un 20,1% y la distribución de estadios fue en forma de U (grupo A: 9,3%, B: 4,3%, C: 2,0% y D: 4,6%). Con los criterios de las orientaciones ALAT la prevalencia fue de un 19,7%, con una distribución de estadios en forma de campana (leve: 2,9%, moderada: 9%, grave: 5,4% y muy grave: 2,7%). Al utilizar las orientaciones de la ALAT, aproximadamente un 73% de los pacientes fue adjudicado a los estratos de EPOC moderada (45,4%) o grave (27,3%), mientras que con los criterios GOLD-2013 la mayoría (aproximadamente un 69%) se clasificó en los grupos A (46,3%) y B (22,7%). Con la estratificación ALAT las puntuaciones del índice BODE aumentaron al empeorar la EPOC, lo que no se observó con los criterios GOLD-2013 (los valores de los grupos B y C fueron similares).
ConclusionesLa distribución de pacientes en los estadios de la enfermedad difiere según se usen los criterios de la ALAT o GOLD-2013. Los criterios de la ALAT identificaron una mayor proporción de pacientes en las categorías moderada y grave de EPOC que los criterios GOLD-2013, con los cuales la mayoría de pacientes fueron adjudicados al grupo A. En futuras evaluaciones de la clasificación ALAT se debería analizar su capacidad predictiva de hospitalizaciones y mortalidad.
Forced expiratory volume in 1s (FEV1) alone fails to represent the complexity of COPD. For this reason, several multidimensional COPD staging systems have been proposed to support clinical decision-making.1–4 The new Global Initiative for Chronic Obstructive Lung Disease (GOLD) document has proposed a classification system for COPD that combines clinical symptoms with exacerbation history and airflow limitation (FEV1% predicted) to categorize disease into 4 groups (A, B, C, D).1
Studies in different populations have evaluated the new GOLD assessment system,5–10 showing an uneven distribution of patients. Han et al. (COPDGene study) reported that based on the modified Medical Research Council (mMRC) scale, 33.6% of patients were assigned to GOLD group A, 20.5% to group B, 7.9% to group C, and 38% to group D.5 Similar findings were reported in other selected COPD populations.6,7 However, Johannessen et al. found 20% of COPD patients to be classified as group A, 30% as group B, 6% as group C, and 44% as group D.8 Pooled data across 2 similar studies found that in the general population in Copenhagen, the distribution was 77% in group A, 14% in group B, 4% in group C, and 5% in group D,9 while a large UK database of primary care COPD patients found the distribution of stages using GOLD (2011) to be 36.1% of patients in group A, 19.1% in group B, 19.6% in group C, and 25.3% in group D.10
Comparisons between different versions of the GOLD staging system have been published previously.6,7,9,10 Casanova et al. showed that using the new GOLD classification resulted in subjects being assigned to more advance stages compared with the earlier system.7 Two large population-based cohort studies in Denmark compared the new and previous GOLD classifications and found that in both, patients were “shifted” to GOLD A and D in the new classification (one-third of patients each classified as A or D, and one-sixth of patients each classified as B or C).9 In contrast, a study in primary care identified greater proportions of patients in the less and more advanced categories when comparing GOLD-2011 and 2007 classifications.10 It has also been shown that the new GOLD proposal is no better at predicting mortality than the earlier version.6,9
Limited information and comparisons exist between old or new GOLD staging systems versus other COPD stratifying proposals.11–13
The Asociación Latino americana de Tórax (ALAT) guidelines2 propose a multidimensional COPD staging system, which takes into account the degree of dyspnea (mMRC scale), airflow limitation (FEV1% predicted), and the presence of exacerbations or hospitalizations due to exacerbations over the past 12 months. No study has evaluated the distribution of a COPD population according to this stratification. Therefore, the objectives of this study were to compare the prevalence and distribution of COPD stages according to different evaluation criteria (ALAT, GOLD-2007 and GOLD-2013), to determine the distribution of GOLD-2013 groups within each of the ALAT stages, and to analyze the differences in the clinical characteristics in a population of COPD subjects attending primary care settings of 4 Latin American countries according to different COPD staging systems.
MethodsThe Prevalence Study and Regular Practice, Diagnosis and Treatment, Among General Practitioners in Populations at Risk of COPD in Latin America (PUMA) was conducted in the primary care setting in 4 countries: Argentina, Colombia, Venezuela and Uruguay. Complete details of the methodology have been published previously.14–17 Briefly, this was a multicenter, multinational, cross-sectional, non-interventional study. Participating sites were selected according to local feasibility from previous locally available databases of potential principal investigators (i.e. non-randomized) and included primary care centers (family doctors, general practitioners) with no connection with respiratory medicine specialists. These sites were selected to reflect the reality of national primary care practice taking into consideration both geographical distribution and healthcare sector. The ethics committees for each site involved in the study approved the protocol and all participants provided written informed consent.
At-risk patients were included in the study: ≥40 years of age, current or ex-smokers (≥10 pack-years, ≥50 pipes/year or ≥50 cigars/year) and/or exposure to biomass smoke (exposure ≥100h/year).
Participants completed a modified version of the PLATINO study questionnaire for information on factors potentially associated with COPD.18 Spirometry was performed using the ultrasound Easy One spirometer (ndd Medical Technologies, Zurich, Switzerland). Spirometry tests were performed at baseline and after 400μg of salbutamol, according to the American Thoracic Society (ATS) criteria.
COPD diagnosis according to GOLD-2007 criteria was based on post-bronchodilator (post-BD) FEV1/forced vital capacity (FEV1/FVC)<0.70. Although symptoms are mentioned in the GOLD-2007 staging system, they are not considered to relate to staging, which is based on FEV1% predicted normal: stage 1: mild, FEV1≥80%; stage 2: moderate, 50%–80%; stage 3: severe, 30%–50%; stage 4: very severe FEV1<30%.19 GOLD-2013 classified patients into groups A to D1; group A: low risk and low symptoms (GOLD-2007 stage 1–2, and/or 0–1 exacerbation per year, and mMRC 0–1 or COPD Assessment Test [CAT] score <10);group B: low risk, higher symptoms (GOLD-2007 stage 1–2, and/or 0–1 exacerbation per year, and mMRC≥2 or CAT score≥10); groups C and D: high-risk groups, both characterized by GOLD-2007 stage 3–4, and/or >2 exacerbations or 1 hospitalization in the previous year; group C has a low frequency of symptoms (mMRC 0–1 or CAT score<10) while group D has more frequent symptoms (mMRC≥2 or CAT score≥10). In the PUMA questionnaire, the CAT data were not collected, so the stratification of symptoms in the GOLD-2013 system was based on the mMRC scale.
Based on ALAT guideline, COPD was considered as a diagnosis in patients who were: ≥40 years of age, had a history of “ever” smoking or biomass exposure ≥10 years, were symptomatic or asymptomatic, and had a confirmatory post-BD FEV1/FVC<0.70. ALAT classification ranges from mild to very severe based on dyspnea severity (mMRC: mild, 0–1; moderate, 2; severe, 3; very severe, 4), airflow limitation (FEV1% predicted: mild>80%, moderate 50%–80%, severe 30%–50%, very severe<30%) and the risk of exacerbations (moderate to severe) evaluated by the history of exacerbations or hospitalizations in the past year (≥2 exacerbations requiring the use of corticosteroids and/or antibiotics or ≥1 hospitalizations due to exacerbations as indicators of severe or very severe illness).2 If there is a discrepancy between the intensity of the variables, the one with the highest score should be used to define the severity.
The BODEx index was calculated to assess the prognostic value of the stratification systems.20 The BODEx index score ranges from 0–9 points and is grouped into the following quartiles: quartile 1: 0–2 points; quartile 2: 3–4 points; quartile 3: 5–6 points; quartile 4: 7–9 points.
Statistical AnalysisDescriptive statistics were performed using absolute and relative frequencies for categorical variables and mean (median) and standard deviation for numerical variables. Comparisons between categorical variables were made using chi-squared tests. When numerical outcomes were compared, t-test or ANOVA were performed. Comparisons with a P-value of <.05 were considered statistically significant. All analyses were conducted using Stata 13.0 software.
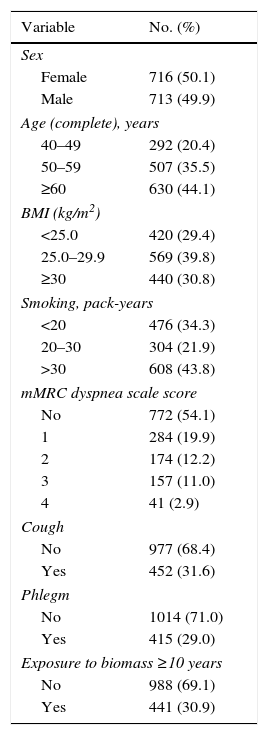
ResultsParticipation rates in the PUMA study have been published elsewhere.14–17 Among the 1743 patients that completed the questionnaires, 1540 had acceptable spirometry. Table 1 shows the characteristics of patients in the PUMA study. Subjects were evenly distributed according to gender, 30% were exposed to biomass (coal or wood for >10 years), 44% were >60 years, and 44% smoked >30 pack-years.
General Sample Characteristics.
| Variable | No. (%) |
|---|---|
| Sex | |
| Female | 716 (50.1) |
| Male | 713 (49.9) |
| Age (complete), years | |
| 40–49 | 292 (20.4) |
| 50–59 | 507 (35.5) |
| ≥60 | 630 (44.1) |
| BMI (kg/m2) | |
| <25.0 | 420 (29.4) |
| 25.0–29.9 | 569 (39.8) |
| ≥30 | 440 (30.8) |
| Smoking, pack-years | |
| <20 | 476 (34.3) |
| 20–30 | 304 (21.9) |
| >30 | 608 (43.8) |
| mMRC dyspnea scale score | |
| No | 772 (54.1) |
| 1 | 284 (19.9) |
| 2 | 174 (12.2) |
| 3 | 157 (11.0) |
| 4 | 41 (2.9) |
| Cough | |
| No | 977 (68.4) |
| Yes | 452 (31.6) |
| Phlegm | |
| No | 1014 (71.0) |
| Yes | 415 (29.0) |
| Exposure to biomass ≥10 years | |
| No | 988 (69.1) |
| Yes | 441 (30.9) |
| Lung Functions Parameters | Mean (SD) |
|---|---|
| FEV1 (L) | 2.41 (0.79) |
| FEV1 (% predicted)a | 84.70 (20.04) |
| FEV1 (z-scores)b | −0.01 (1.02) |
| FVC (L) | 3.17 (0.88) |
| FVC (% predicted)a | 87.62 (15.91) |
| FVC (z-scores)b | −0.01 (1.01) |
| FEV1/FVC ratio | 75.46 (10.54) |
According to equations (where sex is coded as 0=female and 1=male and skin color is coded as 0=no and 1=yes):
- (1)
FEV1=−0.610+height∗(0.028)+sex∗(0.406)+age∗(−0.034)+white∗(0.336)+indigenous∗(0.336)+brown∗(0.304)+black∗(0.326).
- (2)
FVC=−1.934+height∗(0.038)+sex∗(0.549)+age∗(−0.029)+white∗(0.320)+indigenous∗(0.159)+brown∗(0.294)+black∗(0.303).
A total of 282 subjects met criteria for COPD according to ALAT guidelines and 287 subjects according to GOLD-2013 recommendations. Five subjects met criteria according to GOLD-2013 but not according to ALAT guidelines due to not having a smoking history >10 pack-years.
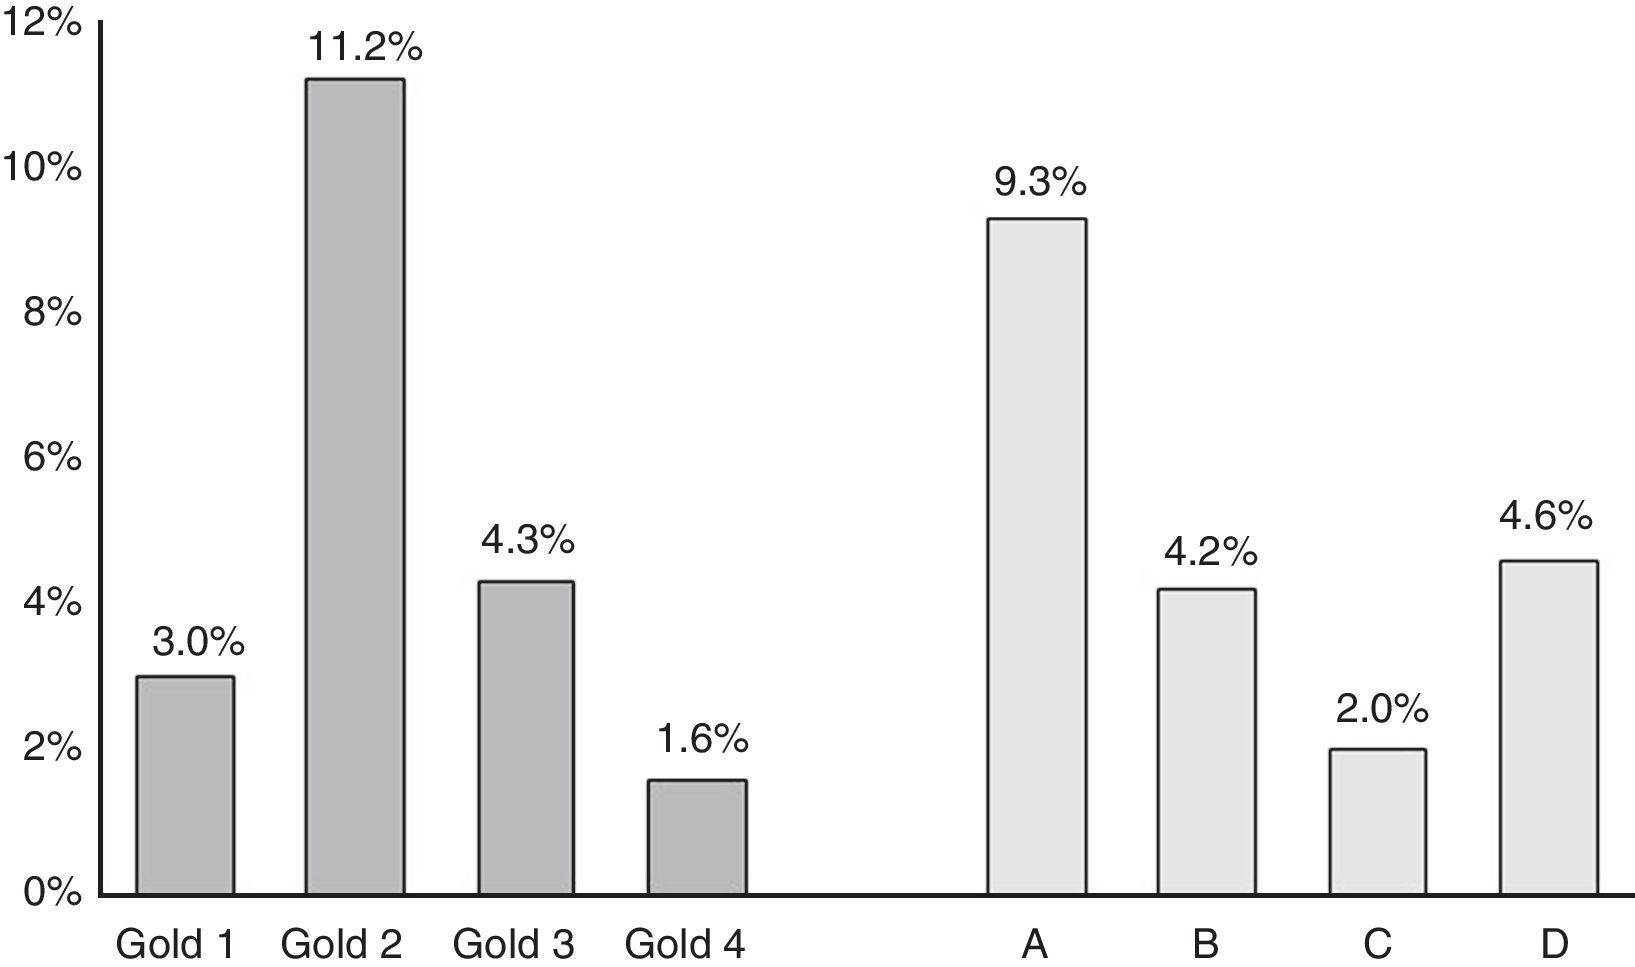
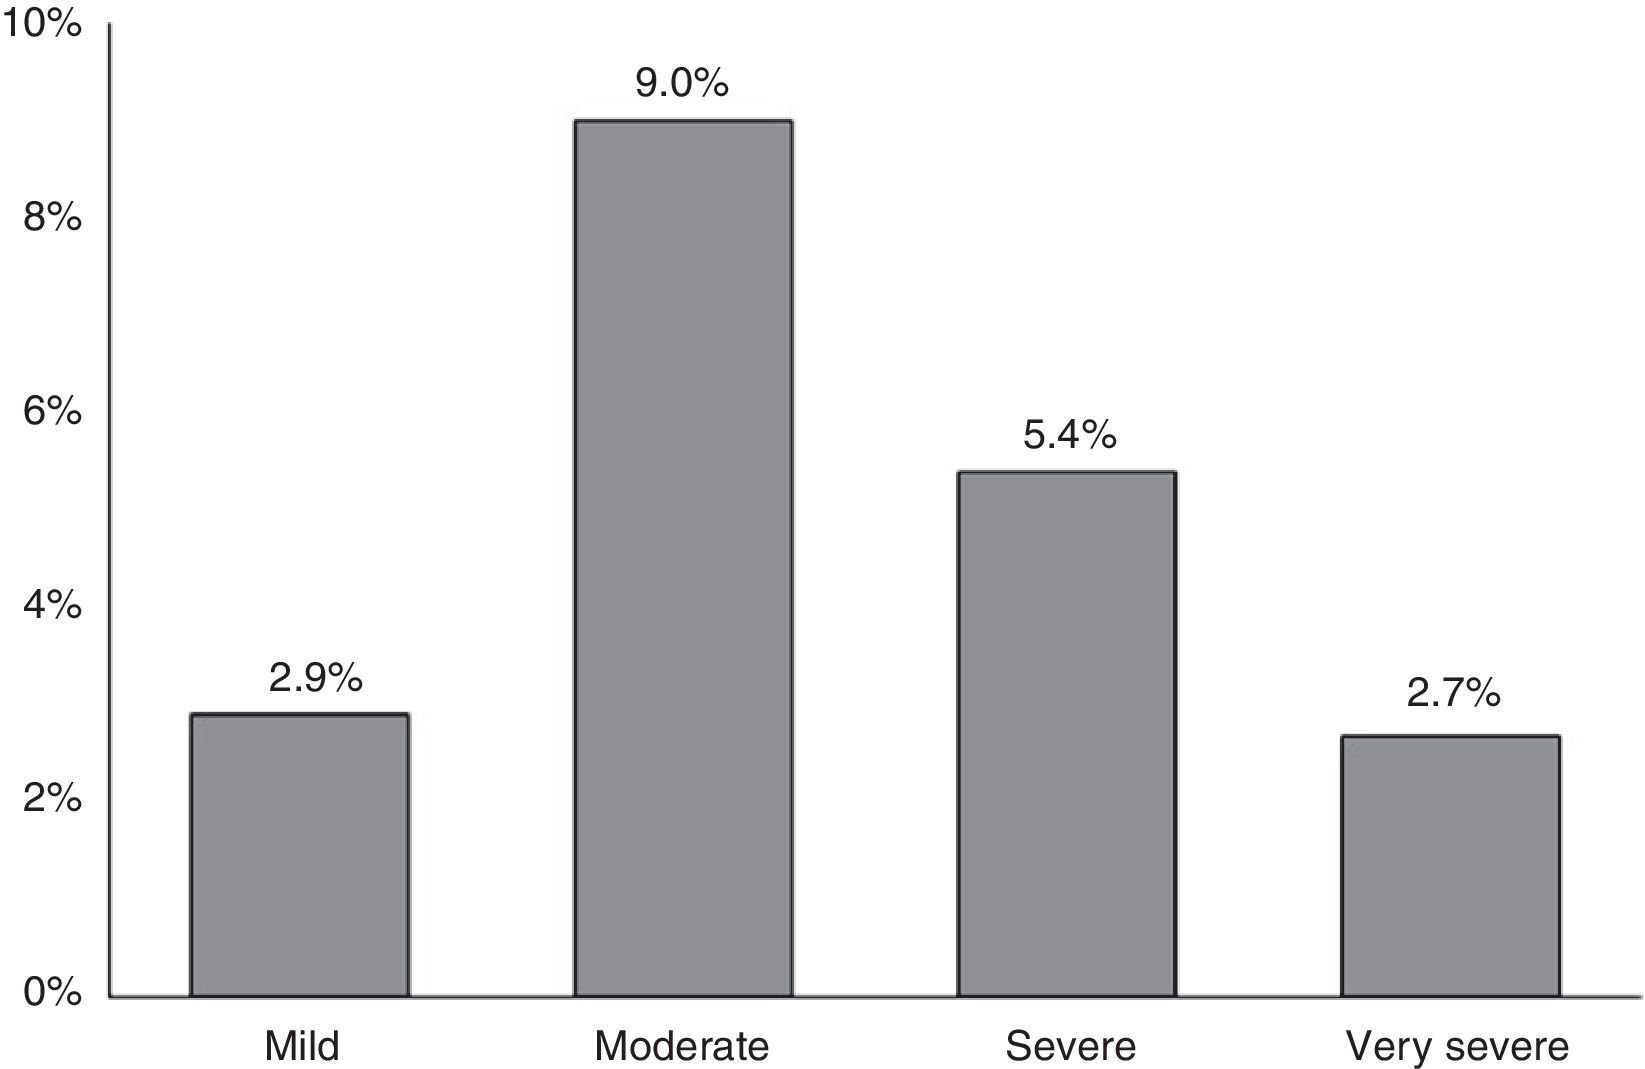
COPD prevalence according to GOLD-2013 was 20.1%.16 Prevalence of the different COPD stages according to the previous GOLD-2007 and GOLD-2013 classifications is shown in Fig. 1. According to GOLD-2007, most patients were classified in intermediate stages 2 (11.2%) and 3 (4.3%) (bell-shaped distribution), whereas with GOLD-2013 the extreme categories, groups A (9.3%) and D (4.6%), had the highest prevalence (U-shaped distribution) (Fig. 1). COPD prevalence by ALAT criteria was 19.7%. The ALAT system displayed a similar severity prevalence distribution (bell-shaped; Fig. 2) to GOLD-2007.
 and new GOLD-2013 (groups A, B, C and D) classifications.")

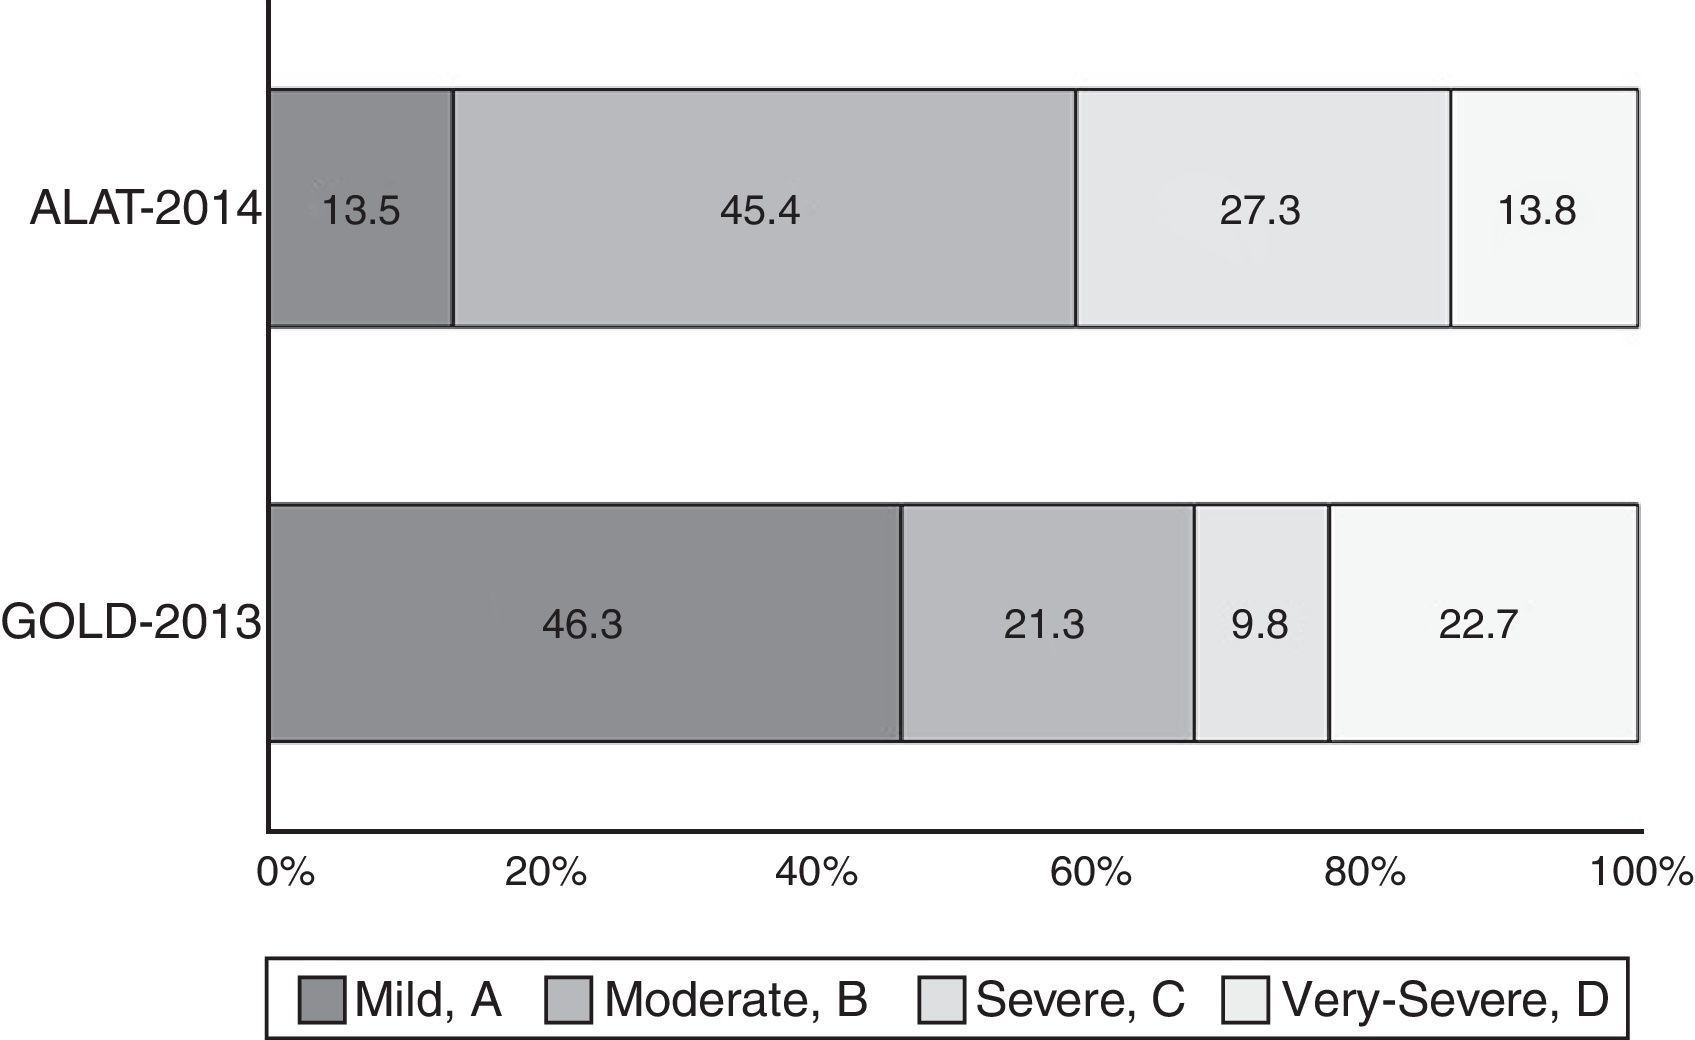
The proportion of COPD individuals in each of the different stages according to ALAT and GOLD-2013 classifications is shown in Fig. 3. Approximately 73% of subjects were classified as moderate (45.4%) or severe (27.3%) using the ALAT system, and using GOLD-2013 the majority (∼69%) were assigned to groups A (46.3%) and B (22.7%).
 and GOLD-2013 (groups A, B, C and D) classifications.")
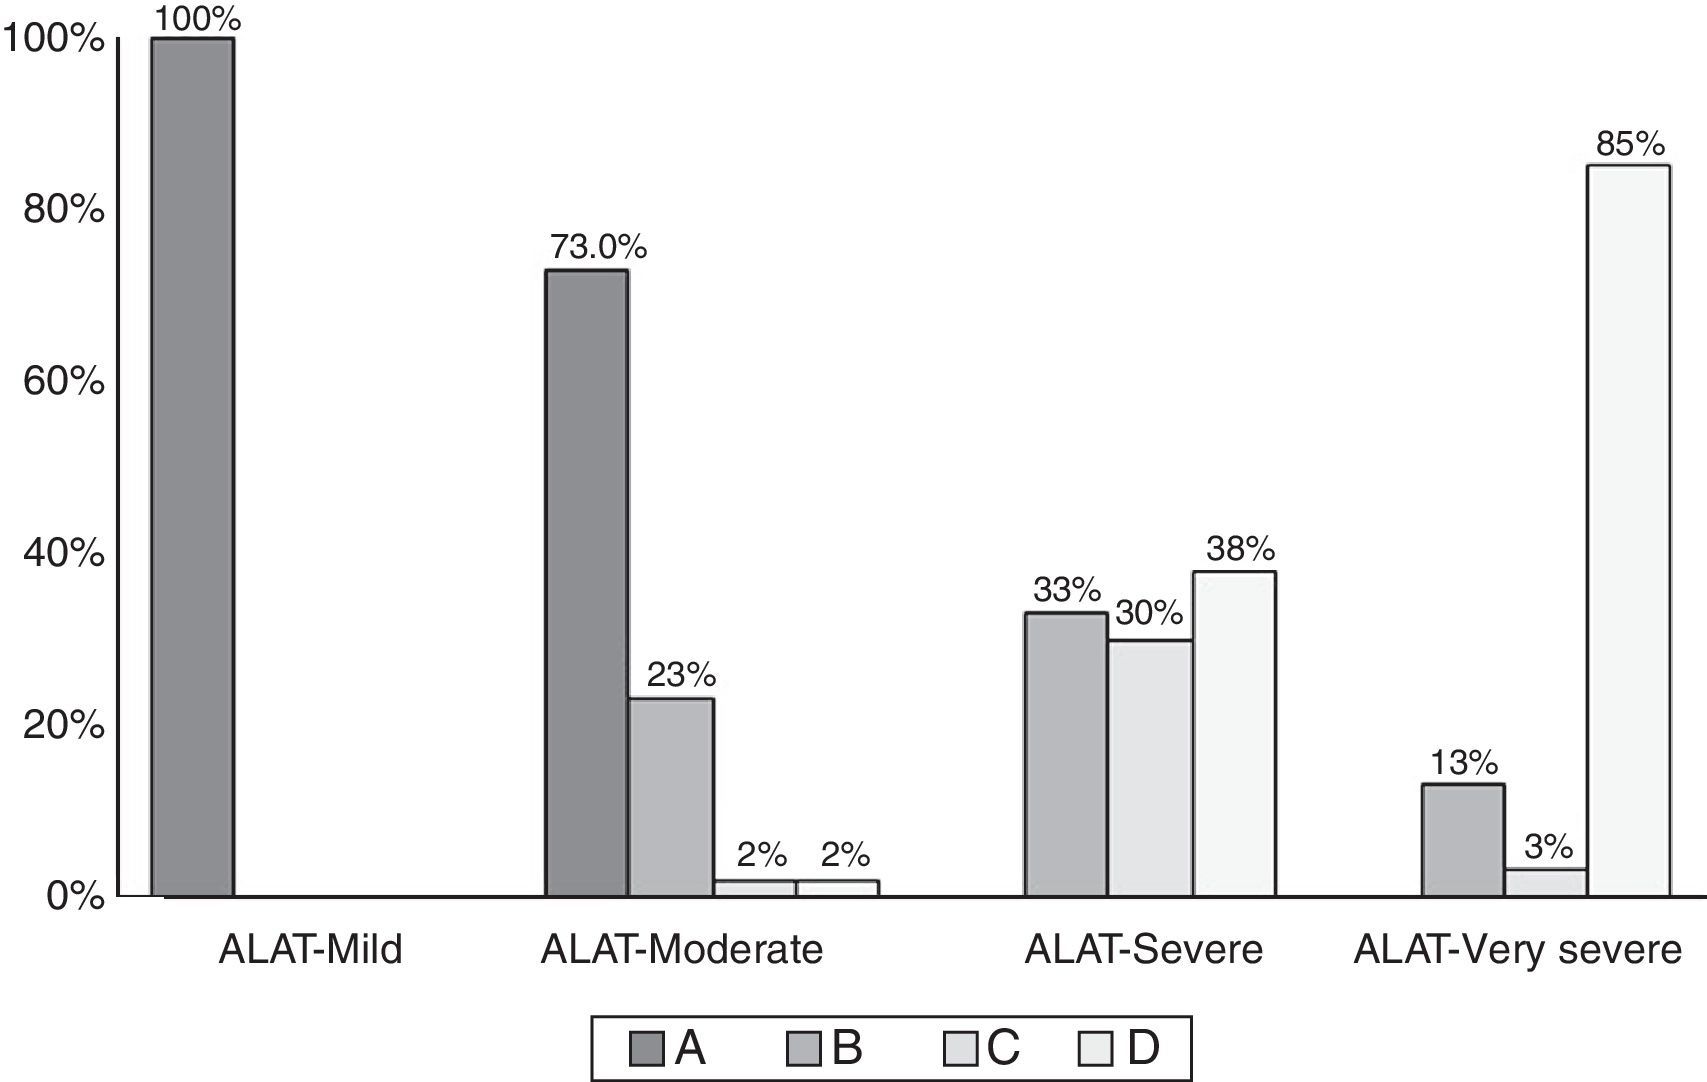
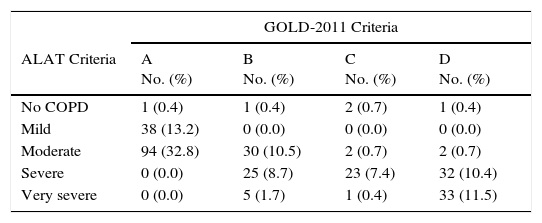
Comparison of COPD subjects according to ALAT and GOLD criteria is shown in Table 2. The distribution of the GOLD-2013 groups within each ALAT stage is shown in Fig. 4. All subjects in the ALAT mild stage were in the GOLD-A stage; in the ALAT moderate stage, 73% of subjects were in GOLD-A and 23% in GOLD-B; in the severe ALAT stage, approximately one-third of patients were categorized in GOLD groups B (33%), C (30%) and D (38%); and in the very severe ALAT stage, the majority of patients were in GOLD-D (85%).
Comparison Between COPD According to ALAT and GOLD Criteria.
| GOLD-2011 Criteria | ||||
|---|---|---|---|---|
| ALAT Criteria | A No. (%) | B No. (%) | C No. (%) | D No. (%) |
| No COPD | 1 (0.4) | 1 (0.4) | 2 (0.7) | 1 (0.4) |
| Mild | 38 (13.2) | 0 (0.0) | 0 (0.0) | 0 (0.0) |
| Moderate | 94 (32.8) | 30 (10.5) | 2 (0.7) | 2 (0.7) |
| Severe | 0 (0.0) | 25 (8.7) | 23 (7.4) | 32 (10.4) |
| Very severe | 0 (0.0) | 5 (1.7) | 1 (0.4) | 33 (11.5) |

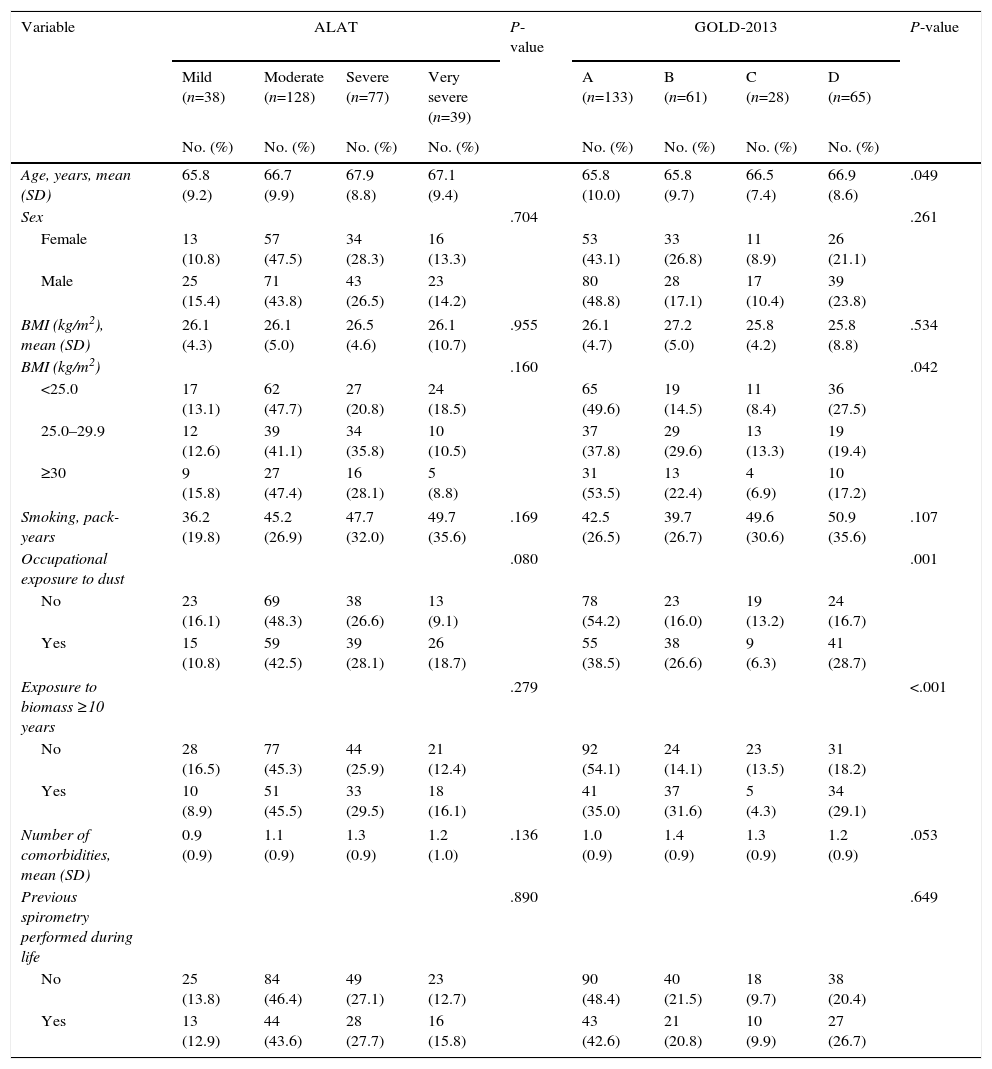
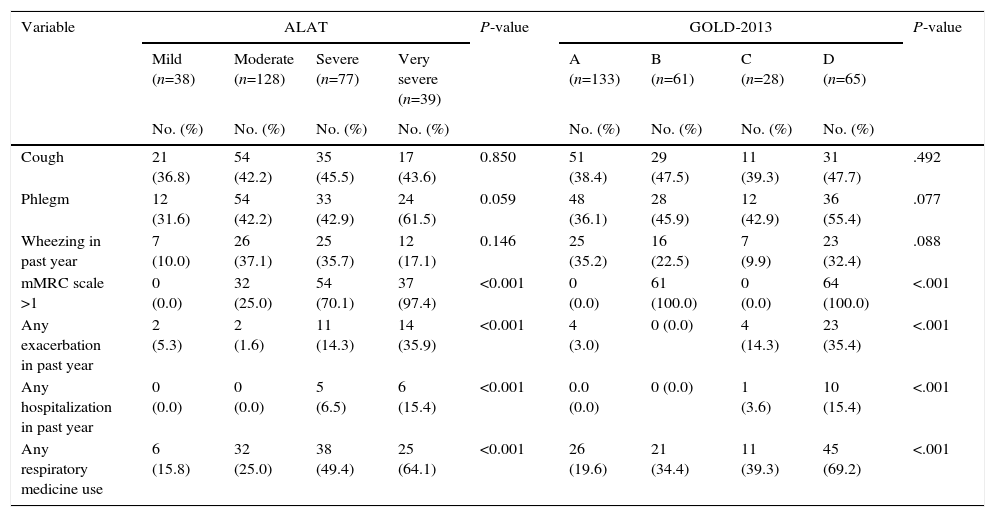
The characteristics of the COPD subjects classified using the GOLD-2013 and ALAT systems are shown in Tables 3 and 4. In the ALAT classification, the prevalence of dyspnea, mMRC>1, exacerbation frequency, use of respiratory medication, degree of airway obstruction, and BODEx index score increases as the severity of the disease worsens. There were no differences in the prevalence of other characteristics (wheezing, cough, phlegm, pack-years, BMI and comorbidities) among the ALAT stages. A similar trend was observed using the GOLD-2013 classification (Tables 3 and 4). However, the BODEx index score in groups B and C were very similar.
Demographic, Socioeconomic and Behavioral Characteristics of Individuals According to COPD Stages System.
| Variable | ALAT | P-value | GOLD-2013 | P-value | ||||||
|---|---|---|---|---|---|---|---|---|---|---|
| Mild (n=38) | Moderate (n=128) | Severe (n=77) | Very severe (n=39) | A (n=133) | B (n=61) | C (n=28) | D (n=65) | |||
| No. (%) | No. (%) | No. (%) | No. (%) | No. (%) | No. (%) | No. (%) | No. (%) | |||
| Age, years, mean (SD) | 65.8 (9.2) | 66.7 (9.9) | 67.9 (8.8) | 67.1 (9.4) | 65.8 (10.0) | 65.8 (9.7) | 66.5 (7.4) | 66.9 (8.6) | .049 | |
| Sex | .704 | .261 | ||||||||
| Female | 13 (10.8) | 57 (47.5) | 34 (28.3) | 16 (13.3) | 53 (43.1) | 33 (26.8) | 11 (8.9) | 26 (21.1) | ||
| Male | 25 (15.4) | 71 (43.8) | 43 (26.5) | 23 (14.2) | 80 (48.8) | 28 (17.1) | 17 (10.4) | 39 (23.8) | ||
| BMI (kg/m2), mean (SD) | 26.1 (4.3) | 26.1 (5.0) | 26.5 (4.6) | 26.1 (10.7) | .955 | 26.1 (4.7) | 27.2 (5.0) | 25.8 (4.2) | 25.8 (8.8) | .534 |
| BMI (kg/m2) | .160 | .042 | ||||||||
| <25.0 | 17 (13.1) | 62 (47.7) | 27 (20.8) | 24 (18.5) | 65 (49.6) | 19 (14.5) | 11 (8.4) | 36 (27.5) | ||
| 25.0–29.9 | 12 (12.6) | 39 (41.1) | 34 (35.8) | 10 (10.5) | 37 (37.8) | 29 (29.6) | 13 (13.3) | 19 (19.4) | ||
| ≥30 | 9 (15.8) | 27 (47.4) | 16 (28.1) | 5 (8.8) | 31 (53.5) | 13 (22.4) | 4 (6.9) | 10 (17.2) | ||
| Smoking, pack-years | 36.2 (19.8) | 45.2 (26.9) | 47.7 (32.0) | 49.7 (35.6) | .169 | 42.5 (26.5) | 39.7 (26.7) | 49.6 (30.6) | 50.9 (35.6) | .107 |
| Occupational exposure to dust | .080 | .001 | ||||||||
| No | 23 (16.1) | 69 (48.3) | 38 (26.6) | 13 (9.1) | 78 (54.2) | 23 (16.0) | 19 (13.2) | 24 (16.7) | ||
| Yes | 15 (10.8) | 59 (42.5) | 39 (28.1) | 26 (18.7) | 55 (38.5) | 38 (26.6) | 9 (6.3) | 41 (28.7) | ||
| Exposure to biomass ≥10 years | .279 | <.001 | ||||||||
| No | 28 (16.5) | 77 (45.3) | 44 (25.9) | 21 (12.4) | 92 (54.1) | 24 (14.1) | 23 (13.5) | 31 (18.2) | ||
| Yes | 10 (8.9) | 51 (45.5) | 33 (29.5) | 18 (16.1) | 41 (35.0) | 37 (31.6) | 5 (4.3) | 34 (29.1) | ||
| Number of comorbidities, mean (SD) | 0.9 (0.9) | 1.1 (0.9) | 1.3 (0.9) | 1.2 (1.0) | .136 | 1.0 (0.9) | 1.4 (0.9) | 1.3 (0.9) | 1.2 (0.9) | .053 |
| Previous spirometry performed during life | .890 | .649 | ||||||||
| No | 25 (13.8) | 84 (46.4) | 49 (27.1) | 23 (12.7) | 90 (48.4) | 40 (21.5) | 18 (9.7) | 38 (20.4) | ||
| Yes | 13 (12.9) | 44 (43.6) | 28 (27.7) | 16 (15.8) | 43 (42.6) | 21 (20.8) | 10 (9.9) | 27 (26.7) | ||
Clinical Characteristics of Individuals According to COPD Stages System.
| Variable | ALAT | P-value | GOLD-2013 | P-value | ||||||
|---|---|---|---|---|---|---|---|---|---|---|
| Mild (n=38) | Moderate (n=128) | Severe (n=77) | Very severe (n=39) | A (n=133) | B (n=61) | C (n=28) | D (n=65) | |||
| No. (%) | No. (%) | No. (%) | No. (%) | No. (%) | No. (%) | No. (%) | No. (%) | |||
| Cough | 21 (36.8) | 54 (42.2) | 35 (45.5) | 17 (43.6) | 0.850 | 51 (38.4) | 29 (47.5) | 11 (39.3) | 31 (47.7) | .492 |
| Phlegm | 12 (31.6) | 54 (42.2) | 33 (42.9) | 24 (61.5) | 0.059 | 48 (36.1) | 28 (45.9) | 12 (42.9) | 36 (55.4) | .077 |
| Wheezing in past year | 7 (10.0) | 26 (37.1) | 25 (35.7) | 12 (17.1) | 0.146 | 25 (35.2) | 16 (22.5) | 7 (9.9) | 23 (32.4) | .088 |
| mMRC scale >1 | 0 (0.0) | 32 (25.0) | 54 (70.1) | 37 (97.4) | <0.001 | 0 (0.0) | 61 (100.0) | 0 (0.0) | 64 (100.0) | <.001 |
| Any exacerbation in past year | 2 (5.3) | 2 (1.6) | 11 (14.3) | 14 (35.9) | <0.001 | 4 (3.0) | 0 (0.0) | 4 (14.3) | 23 (35.4) | <.001 |
| Any hospitalization in past year | 0 (0.0) | 0 (0.0) | 5 (6.5) | 6 (15.4) | <0.001 | 0.0 (0.0) | 0 (0.0) | 1 (3.6) | 10 (15.4) | <.001 |
| Any respiratory medicine use | 6 (15.8) | 32 (25.0) | 38 (49.4) | 25 (64.1) | <0.001 | 26 (19.6) | 21 (34.4) | 11 (39.3) | 45 (69.2) | <.001 |
| Mean (SD) | Mean (SD) | Mean (SD) | Mean (SD) | P-value | Mean (SD) | Mean (SD) | Mean (SD) | Mean (SD) | P-value | |
|---|---|---|---|---|---|---|---|---|---|---|
| mMRC scale | 0.3 (0.4) | 0.8 (0.8) | 2.1 (1.1) | 3.4 (0.9) | <0.001 | 0.3 (0.5) | 2.6 (0.6) | 0.6 (0.5) | 2.9 (0.8) | <.001 |
| Number of exacerbations in past year | 0.02 (0.2) | 0.03 (0.1) | 0.3 (0.9) | 1.0 (1.5) | <0.001 | 0.03 (0.2) | 0.0 (0.0) | 0.3 (0.7) | 0.9 (1.4) | <.001 |
| FEV1 (L) | 2.5 (0.5) | 1.8 (0.5) | 1.3 (0.5) | 0.9 (0.4) | <0.001 | 2.0 (0.5) | 1.7 (0.5) | 1.2 (0.3) | 1.0 (0.3) | <.001 |
| FEV1 (% predicted)a | 88.7 (6.7) | 68.9 (11.5) | 52.8 (17.3) | 37.1 (18.4) | <0.001 | 74.3 (12.4) | 72.2 (16.2) | 44.0 (8.9) | 38.8 (14.0) | <.001 |
| FEV1 (z-scores)b | 0.2 (0.4) | −0.8 (0.6) | −1.5 (0.9) | −2.3 (1.3) | <0.001 | −0.6 (0.7) | −0.5 (0.8) | −2.0 (0.6) | −2.2 (1.0) | <.001 |
| FVC (L) | 3.8 (0.9) | 2.9 (0.7) | 2.4 (0.7) | 2.0 (0.7) | <0.001 | 3.2 (0.8) | 2.8 (0.8) | 2.3 (0.7) | 2.0 (0.6) | <.001 |
| FVC (% predicted)a | 99.5 (11.0) | 81.6 (13.2) | 70.5 (15.4) | 58.5 (16.4) | <0.001 | 86.5 (14.0) | 84.6 (15.7) | 64.2 (10.6) | 59.5 (13.6) | <.001 |
| FVC (z-scores)b | 1.0 (0.8) | −0.3 (0.8) | −0.9 (0.9) | −1.7 (1.2) | <0.001 | 0.1 (0.9) | 0.0 (0.9) | −1.3 (0.7) | −1.6 (0.9) | <.001 |
| FEV1/FVC ratio | 66.0 (4.7) | 62.5 (6.3) | 54.8 (9.6) | 45.6 (12.0) | <0.001 | 63.7 (6.0) | 62.4 (6.2) | 51.2 (9.2) | 48.0 (11.1) | <.001 |
| BODEX index | 0.62 (0.14) | 1.18 (0.09) | 3.76 (0.20) | 5.41 (0.28) | <0.001 | 0.47 (0.05) | 2.08 (0.11) | 2.29 (0.11) | 4.84 (0.17) | <.001 |
Maximum number of missing for all categories of COPD stages is for mMRC scale.
According to equations (where sex is coded as 0=female and 1=male and skin color is coded as 0=no and 1=yes):
- (1)
FEV1=−0.610+height∗(0.028)+sex∗(0.406)+age∗(−0.034)+white∗(0.336)+indigenous∗(0.336)+brown∗(0.304)+black∗(0.326).
- (2)
FVC=−1.934+height∗(0.038)+sex∗(0.549)+age∗(−0.029)+white∗(0.320)+indigenous∗(0.159)+brown∗(0.294)+black∗(0.303).
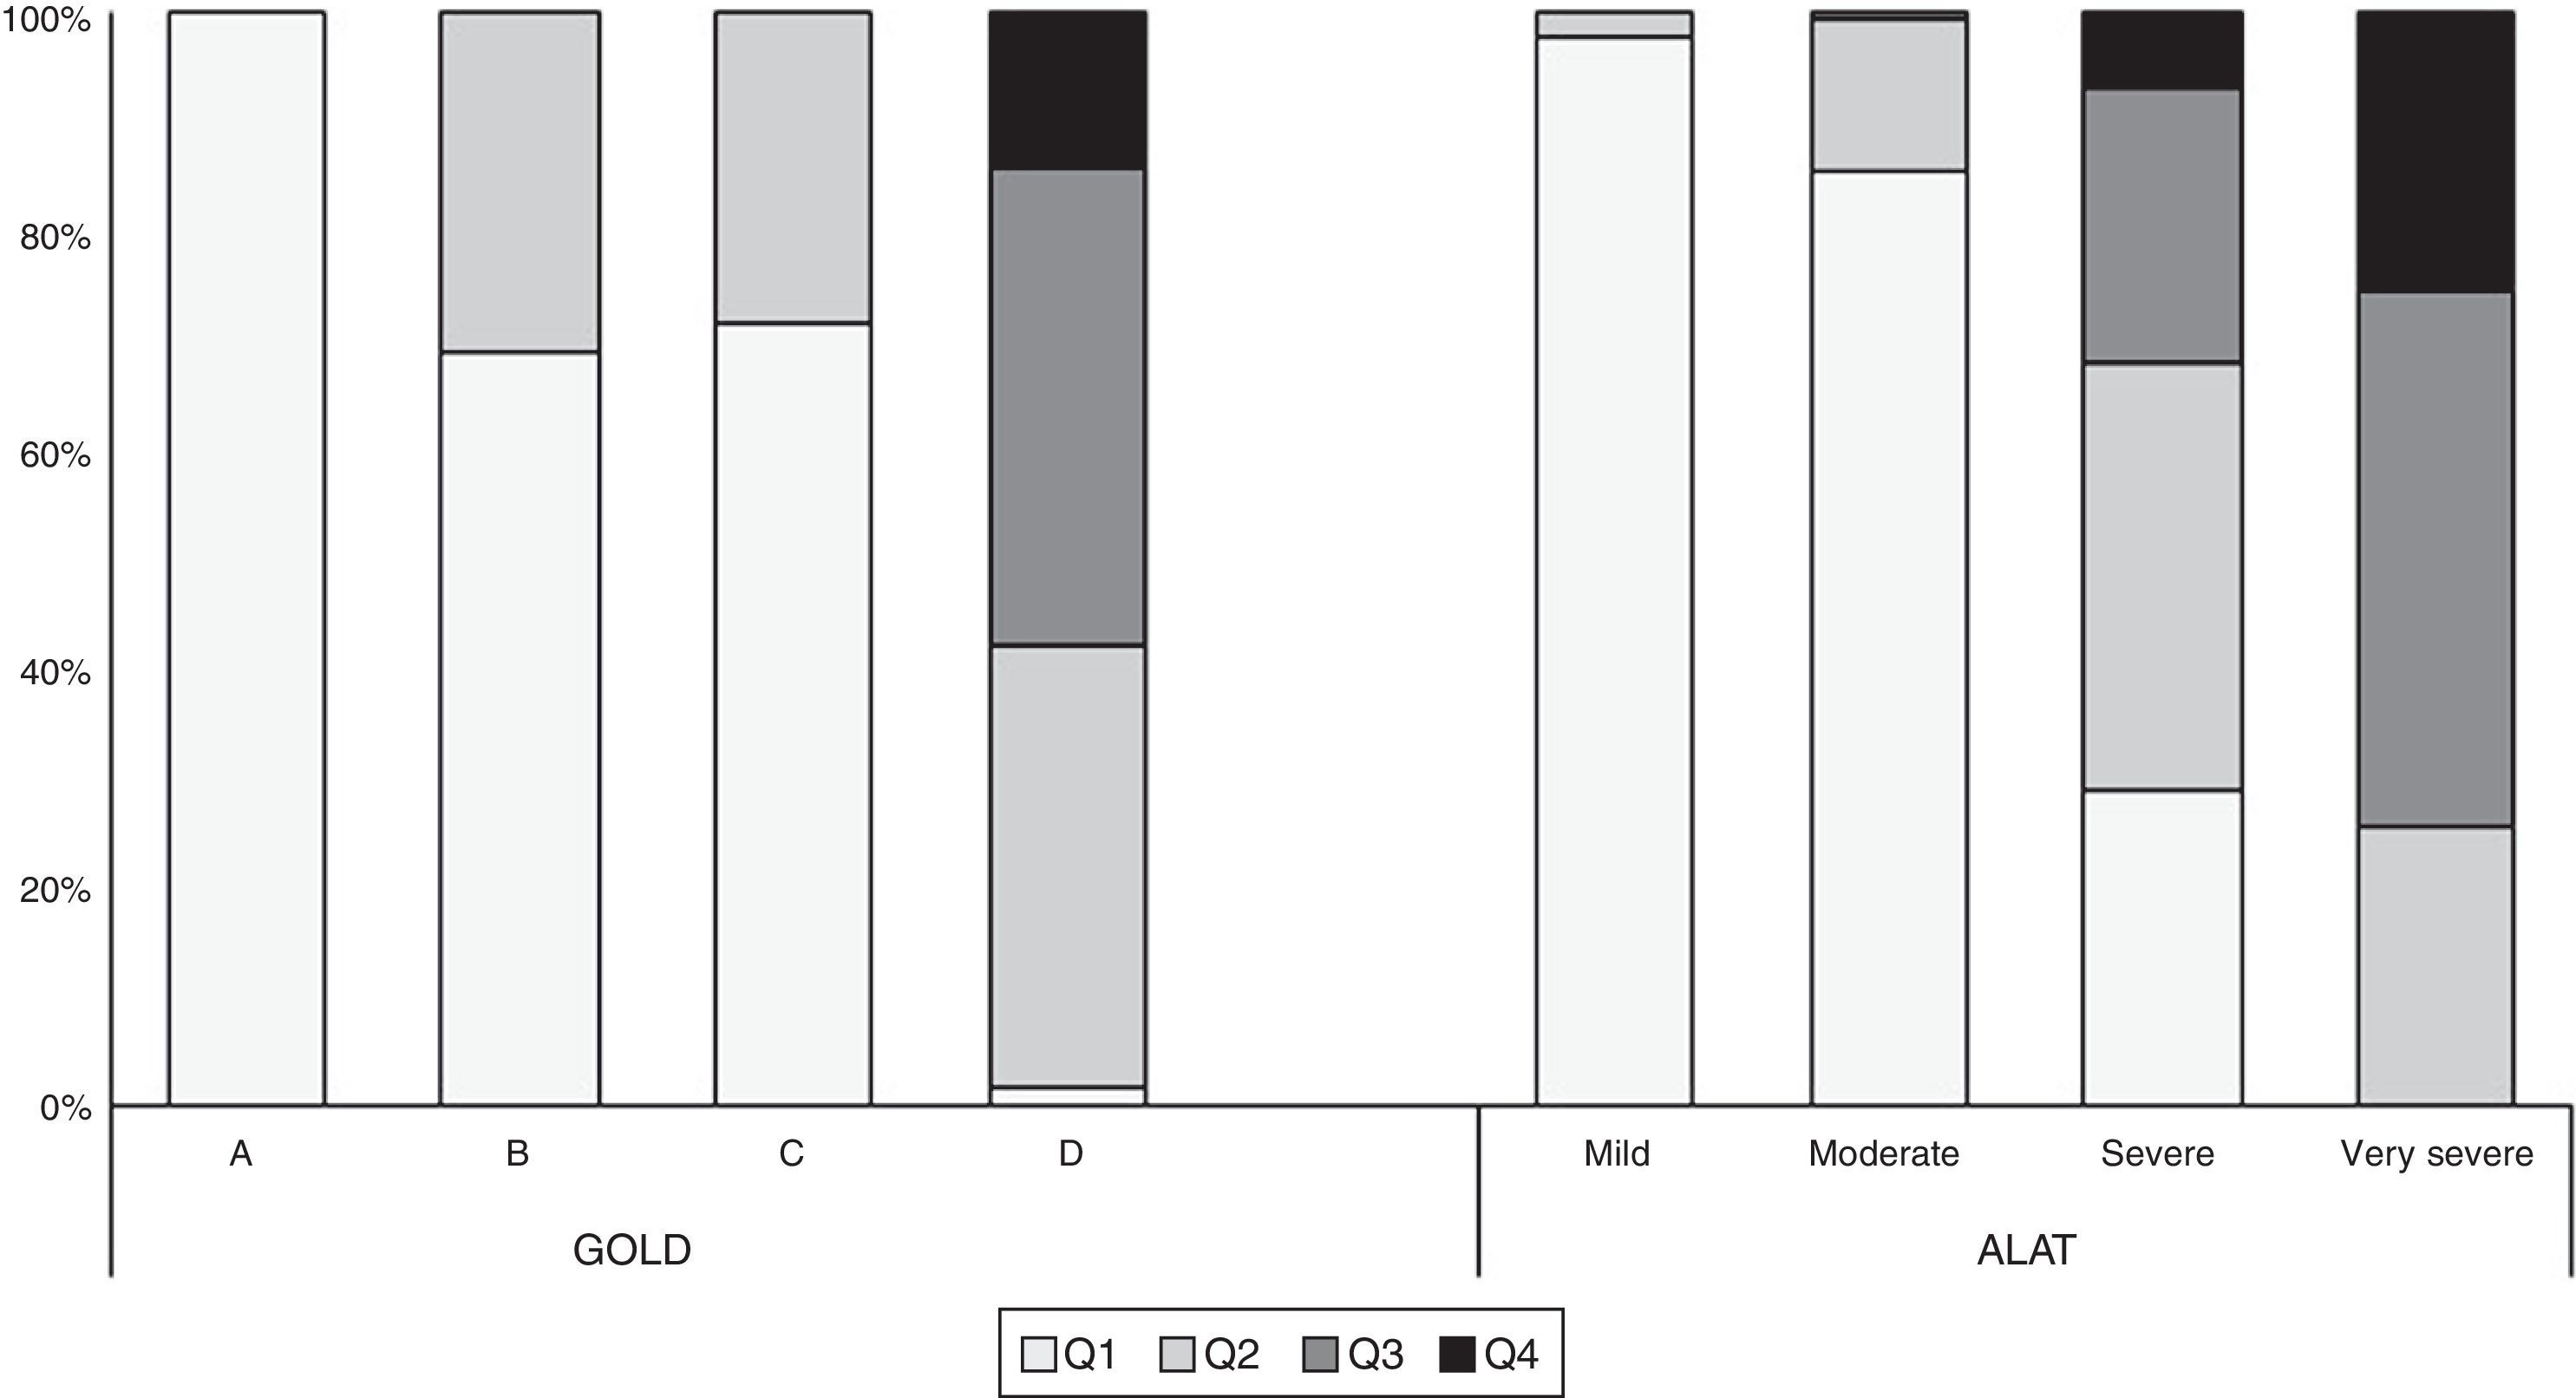
Fig. 5 shows the BODEx index quartiles distribution according to ALAT stages and GOLD-2013 classification. All subjects in the ALAT mild stage were in quartiles 1–2; in the moderate stage, 99% of subjects were in quartiles 1–2; in the severe stage, the majority of the patients (67%) were in quartiles 1–2, around 25% in quartile 3, and the remainder in quartile 4; and in the very severe stage, the majority of patients (66.3%) were in quartiles 3–4. All subjects in GOLD-2013 group A were in quartile 1; in group B all patients were in quartiles 1–2; and in group D the majority of patients (84%) were in quartiles 2–3.
Discussion
The principal findings of this primary care study on COPD prevalence and staging according to different classification systems criteria were as follows. First, according to GOLD-2007 and ALAT classifications, the highest prevalence was observed in the intermediate stages, whereas using GOLD-2013, more patients were classified in the extreme (A and D) groups. Second, more than two-thirds of patients according to ALAT classification were categorized as moderate or severe, whereas using GOLD-2013 the majority (69%) were assigned to groups A (46.3%) and D (22.7%). Third, in both classifications there is greater consistency in the mild and very severe stages and more heterogeneity in the intermediate stages. Fourth, the ALAT stratification showed better agreement with the prognostic index BODEx compared to GOLD-2013.
Several studies have evaluated the distribution of COPD patients according to the previous and new GOLD classification systems.5,6,10,13,21–23 The results in large selected COPD populations found that approximately one-third of patients are classified into GOLD groups A and D (with slightly more patients classified in group D), with the remaining third being classified into either B or C.5,6,21 In other settings, the new GOLD classification produces a different distribution.10,22,23 The use of the GOLD-2011 classification in a large primary care COPD population showed that the largest proportion of patients (36%) was classified into group A, approximately one-fifth were classified into groups B (19.1%) and C (19.6%), and one-quarter (25.3%) into group D.10 A similar distribution was found using the GOLD-2013.22 In contrast, Mapel et al. reported a relatively equal distribution across groups A–D (33%, 22%, 19%, 26%, respectively) using the GOLD mMRC system.23 In the present study, the majority of subjects were assigned to group A (46.3%), 21.3% to group B, 9.8% to group C and 22.7% to group D. Our results are consistent with those reported in larger primary care studies, and suggests a shift in the distribution of patients in this setting toward 2 distinct subgroups (group A and D, with the largest proportion in A).
Very few studies have assessed the distribution of COPD patients according to other stratification criteria different from that of GOLD.11–13 Hwang et al. compared the Korean COPD guidelines with GOLD consensus.12 The Korean guidelines classified patients into 3 groups, combined GOLD groups C and D into a single group, and used different spirometric cut-off values for the high risk of exacerbation from those used in GOLD.12 They concluded that their stratification is useful for differentiating patients at high- and low-risk of exacerbation.12 Miravitlles et al. assessed a group of Spanish patients stratified by different classification systems (GOLD-2007, GOLD-2013, GesEPOC-2012 and BODEx index). According to GOLD-2007, 39.0% patients were moderate, 41.9% severe and 19.1% very severe, and by GOLD-2013, 8.1% patients were in group A, 19.1% in group B, 8.7% in group C and 64.2% in group D. In 24 cases no phenotype classification according to GesEPOC guideline was provided. Among the 322 patients analyzed, 64.3% were classified as non-exacerbators, 6.5% as COPD–asthma overlap, 12.7% as exacerbators with emphysema and 16.5% as exacerbators with chronic bronchitis.13
ALAT recently updated its COPD guidelines and proposes stratifying disease severity on the basis of clinical impact (severity of mMRC dyspnea), functional impact (airflow limitation) and risk of exacerbation or hospitalization for an exacerbation in the previous year.2 No studies have evaluated the distribution of patients according to these stratification criteria. Our results indicate that more patients are classified into stages of moderate or severe disease (45.4% and 27.3%). Based on this, it would appear that the use of the ALAT staging system shifts patients to more severe stages compared with the GOLD-2013 system. In both classifications we also found a higher concordance in the extreme stages and more heterogeneity in the intermediate stages. The lower proportion of mild cases found in the PUMA study might reflect the population originating from primary care (consulting population) rather than the general population. The absence of information from similar studies in the primary care setting makes it difficult to compare our results with others.
The differences found in the distribution of patient stages between the ALAT and GOLD-2013 classifications could be the result of the cut-off values used to stratify airflow obstruction and dyspnea. GOLD-2013 uses the mMRC scale as a tool for assessing symptoms, with a cut-off of ≥2 to indicate a high level of symptoms and <2 to indicate fewer symptoms. The recommended method for assessing airflow limitation was the old GOLD spirometric classification divided into 2 categories, with GOLD stages 3–4 (FEV1<50%) indicating high risk and GOLD stages 1–2 (FEV1≥50%)indicating low risk. However, the ALAT guidelines2 chose 4 cut-off values for the dyspnea mMRC scale (mild: 0–1, moderate: 2, severe: 3, very severe: 4) and airflow limitation (mild: FEV1%≥80%, moderate: 50%–80%, severe: 30%–50%, very severe: <30%), which have been validated in terms of prognosis by the BODE index and other studies.6,8,9,24 These differences could have an impact not only on variations in the distribution of patients across the stages, but also on their predictive characteristics for relevant outcomes in COPD.
Soler-Cataluna et al. assessed the prognostic value of the BODEx index in COPD.20 This index was constructed replacing the exercise capacity of the original BODE index for exacerbation.24 The prognostic value to predict death of the BODEx index is quite similar to that of the BODE index.20,25 Our results indicate that the BODEx index score according to ALAT stratification progressively increases as the severity of COPD worsens. This progression was not observed in the GOLD-2013 groups (groups B and C have similar values). These results argue in favor of a better prognostic value of the ALAT stratification compared with the GOLD-2013 classification. However, these findings will need to be validated in prospective follow-up studies.
This study has some limitations that should be highlighted. We acknowledge that the findings from this study cannot be extrapolated to all Latin American countries, as the study was only conducted in 57 centers in 4 countries and the sample size varied considerably between these countries; this was the result of limited resources within the countries and also the availability of participating centers. Some results might not have reached statistical significance due to sample size and lack of power, despite efforts made to ensure a representative sample. Nevertheless, the study procedure used was the most appropriate given the operational possibilities in each country. To avoid selection bias, centers were selected based on the availability of lists of primary care physicians, and study subjects were those who visited a center spontaneously. Another important limitation is that CAT data were not collected PUMA questionnaire, so symptoms in the GOLD-2013 system could not be stratified using this variable. Using the same parameters to classify patients according to GOLD-2013 and ALAT could minimize differences between the stratification systems.
In conclusion, the results of this study indicate that in the PUMA primary care COPD population there is a difference in the distribution of the patient disease stages when using the ALAT and GOLD-2013 classification systems. The ALAT classification identified a greater proportions of subjects in the moderate and severe categories compared with the GOLD-2013 classification, where the majority of subjects were categorized in group A. Future revisions of the ALAT classification system should address its predictive ability in terms of hospitalizations and mortality and compare these to other proposed stratifications.
FundingThis observational study was funded by AstraZeneca Latin America. Editorial support was provided by Ian Wright and funded by AstraZeneca. All authors had full access to all study data and this manuscript solely reflects their opinions.
Conflicts of InterestAlejandra Silva is an employee of AstraZeneca Latin America.
All other authors declare that they have no real or perceived competing interests.
Please cite this article as: Montes de Oca M, López Varela MV, Laucho-Contreras ME, Casas A, Schiavi E, Rey A, et al. Clasificación de los pacientes con EPOC según los sistemas de estadificación ALAT Y GOLD a partir de datos del estudio PUMA. Arch Bronconeumol. 2017;53:98–106.


